Best MT5 Indicators: The Definitive Guide for Serious Traders
Discover the 10 best MT5 indicators including RSI, MACD, Bollinger Bands, and Ichimoku. Learn powerful indicator combinations, installation tips, and common mistakes to avoid.

Blog posts related to the TradingView
View All TagsDiscover the 10 best MT5 indicators including RSI, MACD, Bollinger Bands, and Ichimoku. Learn powerful indicator combinations, installation tips, and common mistakes to avoid.

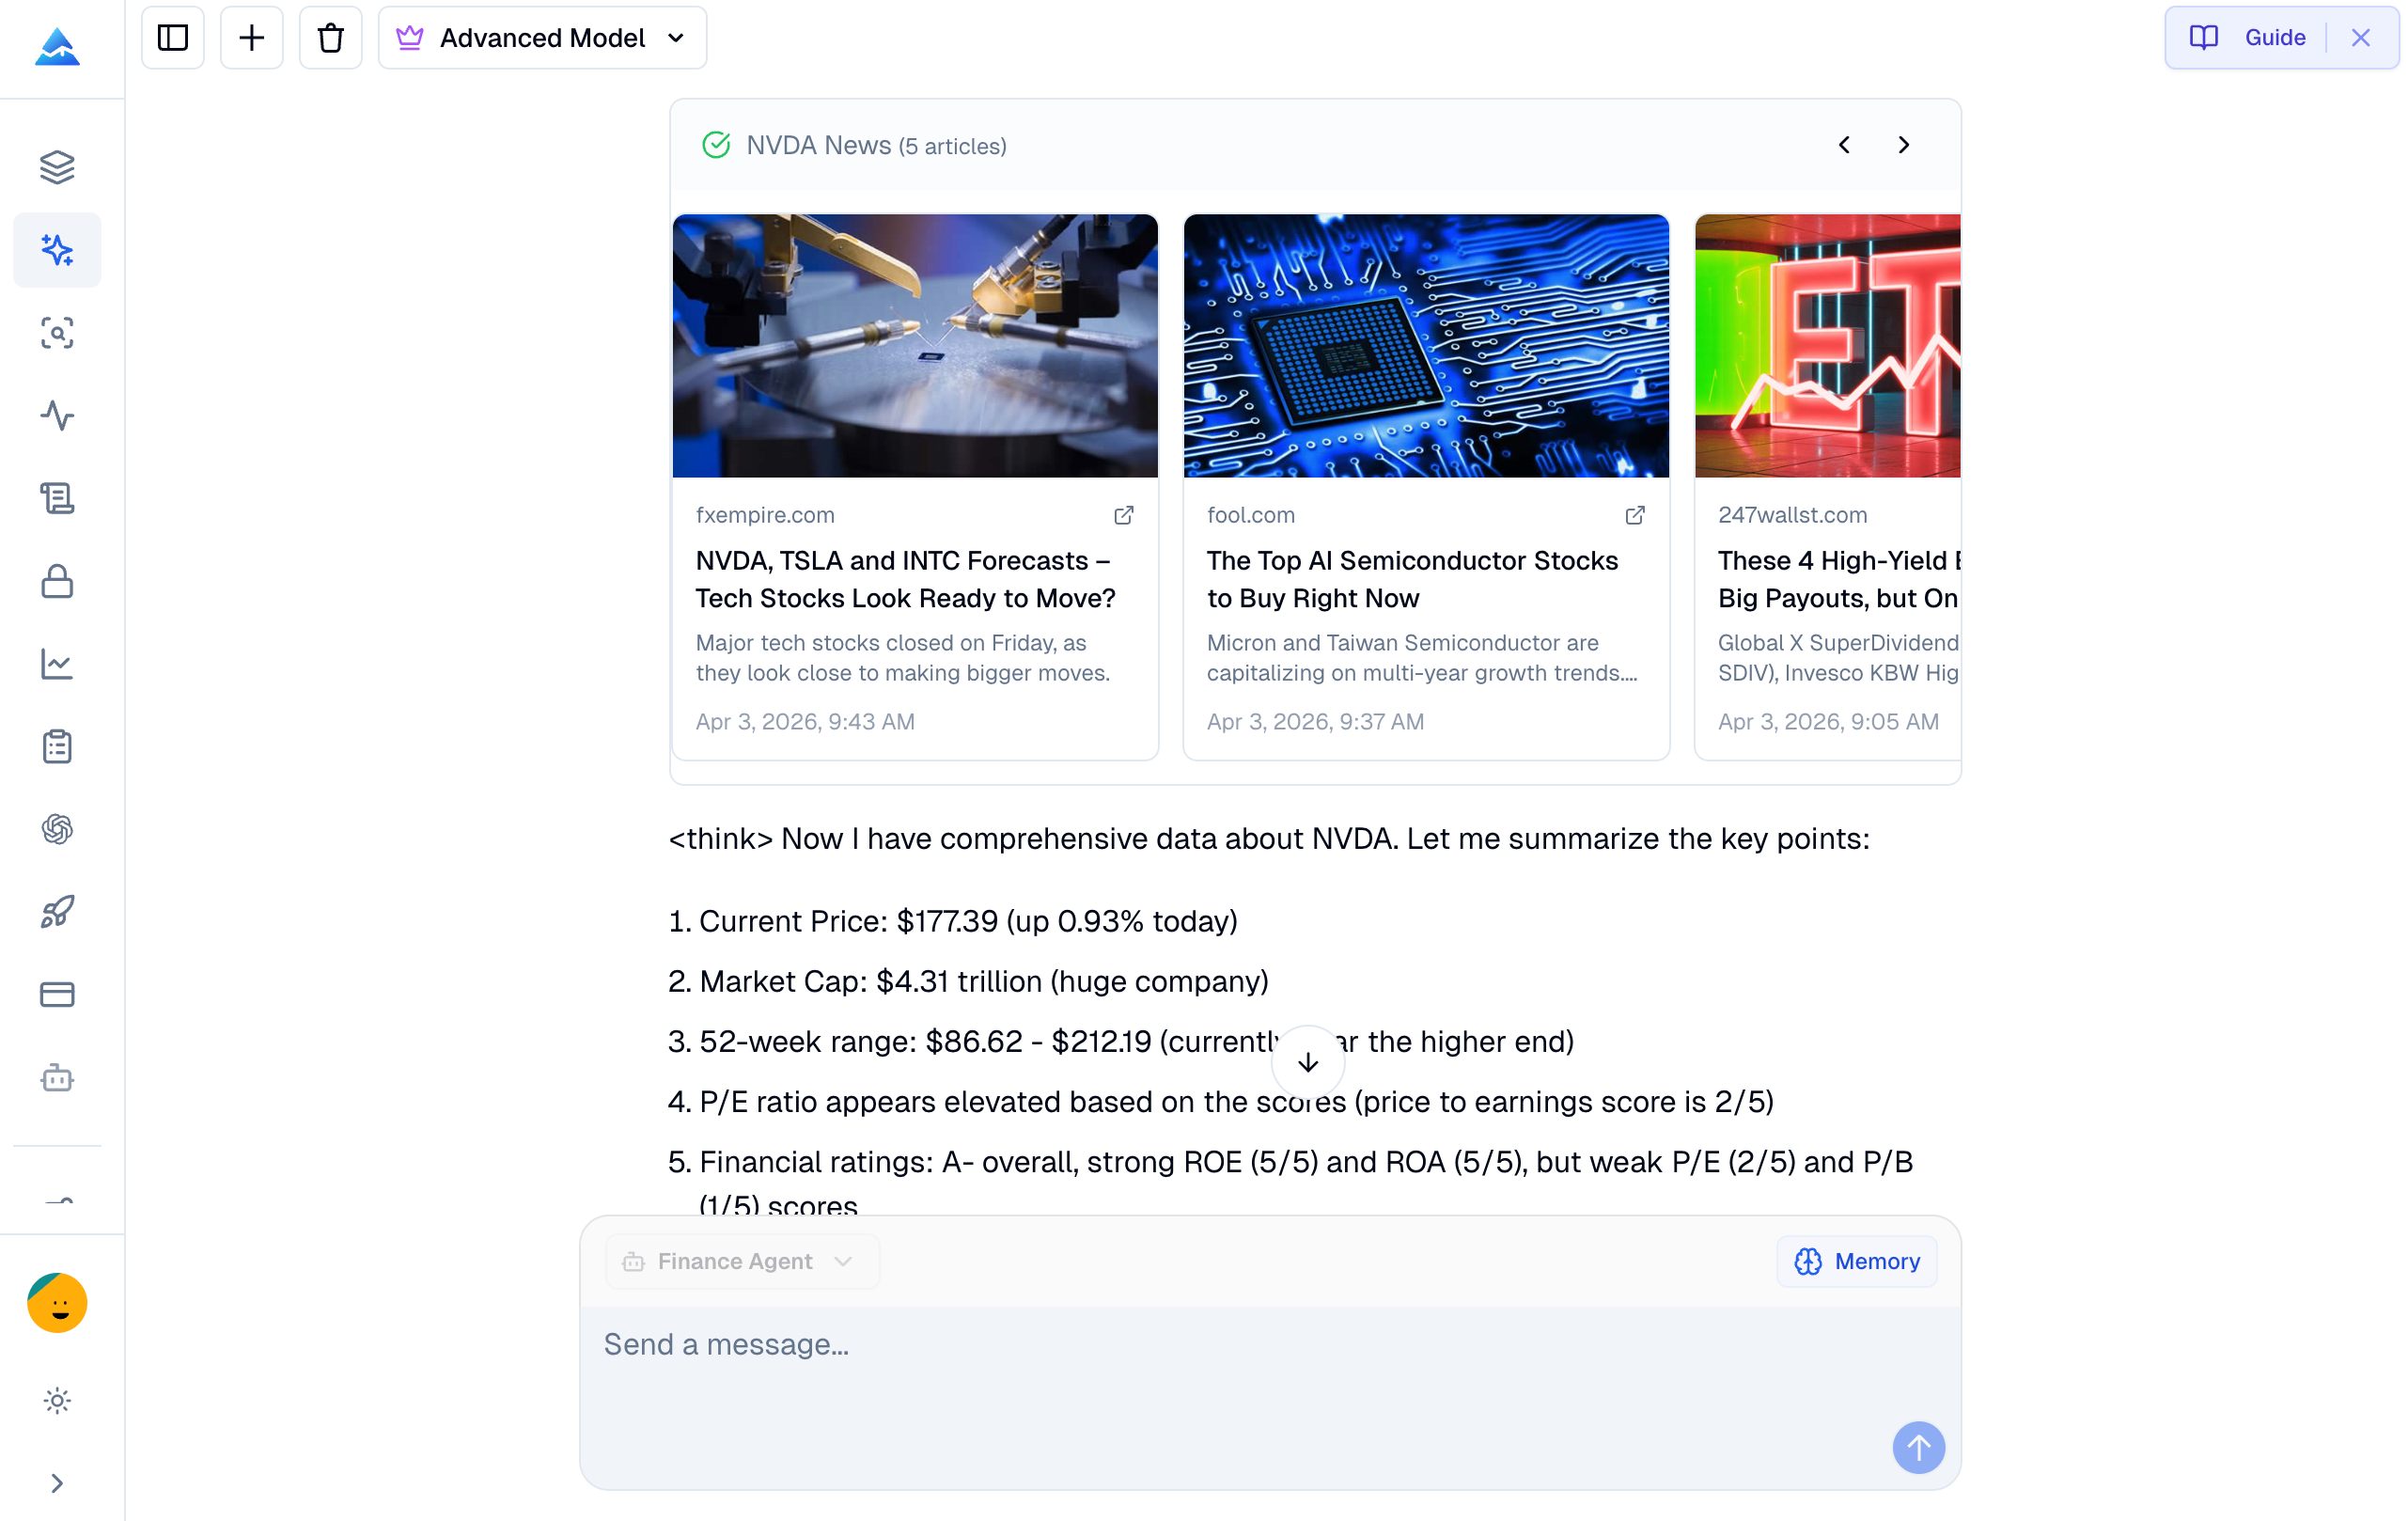
I used to bounce between a free screener, a broker options tab, and a charting tab just to answer one question: is this name actually worth my attention today? The workflow felt fragmented, and I was always one tab short when earnings, dividends, or sentiment mattered. When I moved that routine into Pineify's AI Stock Picker, the difference was less about hype and more about having a single place where scores, chains, and filings line up on the same ticker.
This article covers what the product does, how the 1-10 predictive scoring fits into daily screening, and how the options and fundamentals modules connect — based on my experience as a user, not as personalized financial advice.
Track trades, define strategies, journal your mindset, and review performance.
I used to think my memory was enough. After a streak of wins, I would swear I knew what I was doing; after a drawdown, I would rewrite the story until it felt sensible. The turning point was simple: I started treating trading like a profession that produces data. A serious journal is not nostalgia. It is the operating system for improvement. Pineify’s trading journal is the workflow I reach for when I want one place to log executions, attach context, and read my own behavior honestly. This article is my field note on what it is, what the six core capabilities solve, how analytics and trade entry fit together, and how the four modules turn a log into a growth system.
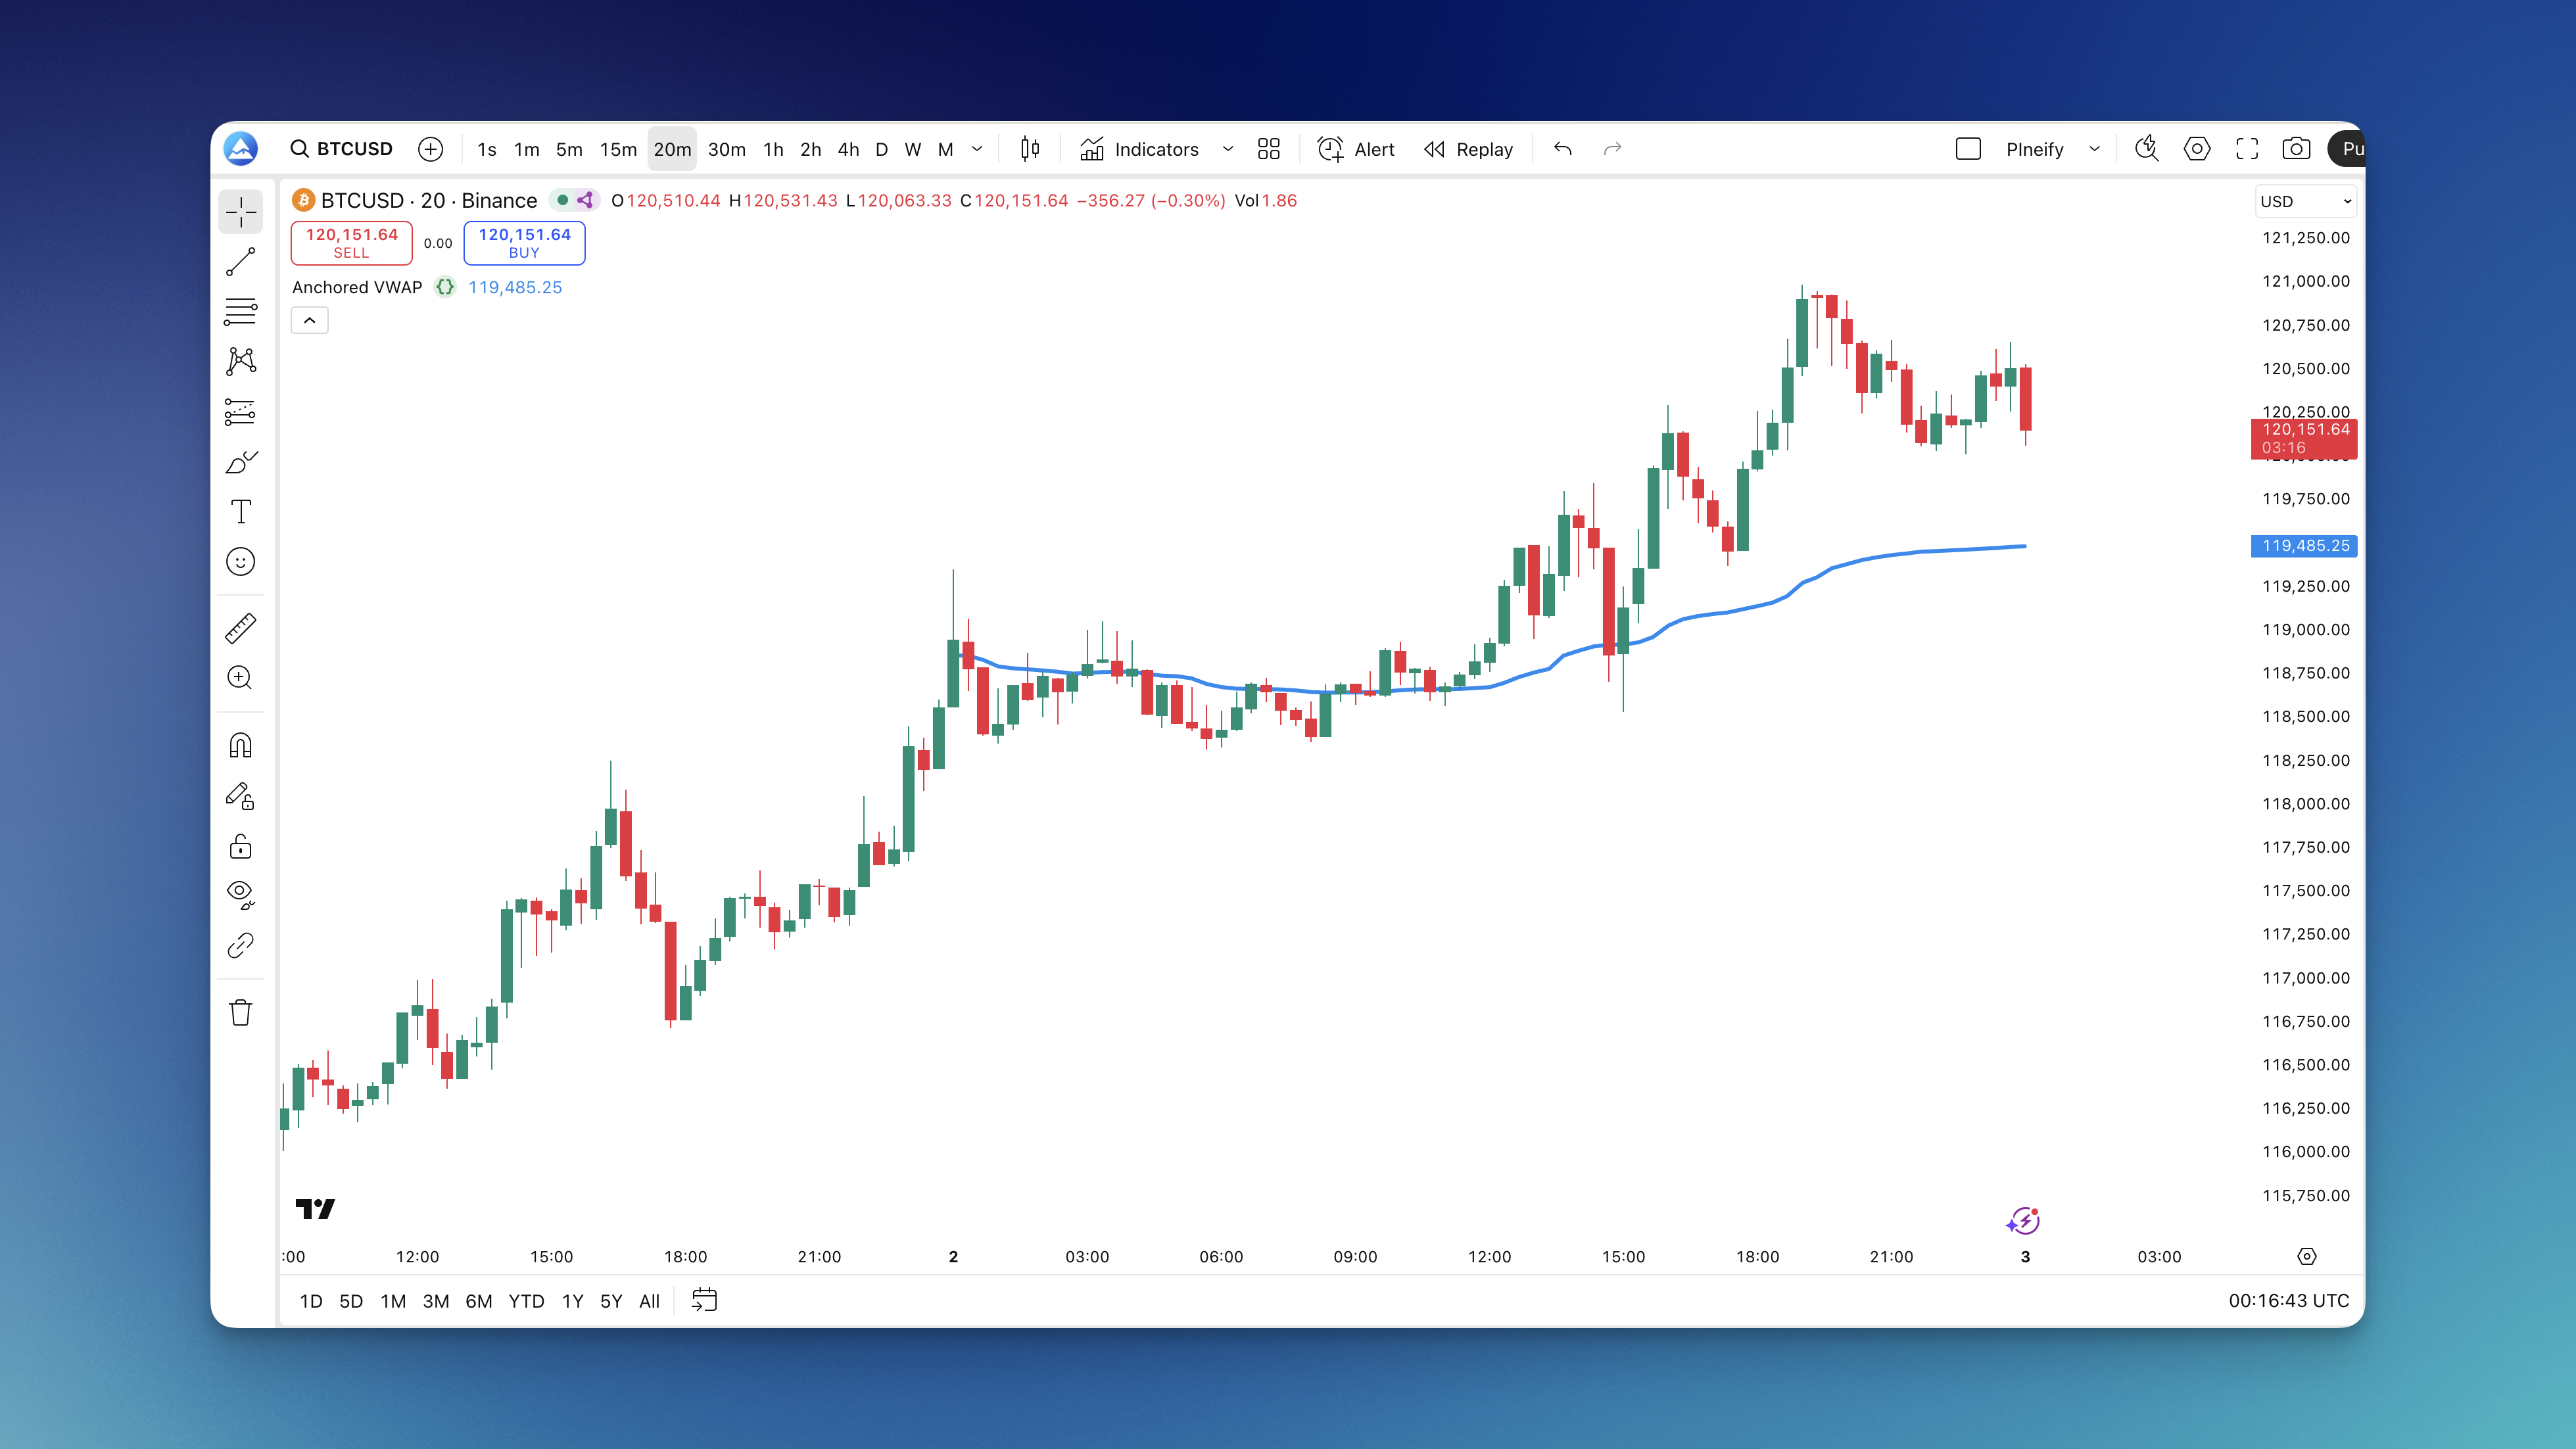
Ever been in a trade where you're just sitting there wondering, "What's a fair price for this thing?" Yeah, me too. That's where Anchored VWAP comes in handy. Unlike regular VWAP that resets every trading session, this lets you anchor to any point you want - earnings releases, breakouts, market opens, whatever makes sense for your strategy.
Apex Trader Funding has really changed the game for futures traders by connecting seamlessly with TradingView through the Tradovate platform. It's like getting the best of both worlds: you use TradingView's incredible charts and tools, but you can place trades directly from there using your funded Apex account. No more juggling between different tabs or programs—everything you need is in one spot.
Look, I've been trading for over a decade, and I can tell you this: while everyone's stuck using the same old simple moving averages and EMAs, there's this one indicator that's been quietly crushing it. The Arnaud Legoux Moving Average (ALMA) isn't just another squiggly line on your chart—it's actually solving the biggest problem every trader faces.
You know that frustrating choice between smooth signals (that come too late) and fast signals (that fake you out constantly)? ALMA fixes that. Created by Arnaud Legoux and Dimitrios Kouzis-Loukas, this thing uses a Gaussian filter approach that's honestly pretty brilliant.
Instead of treating all price data the same way like regular moving averages do, ALMA weights recent prices more heavily using a bell curve distribution. But here's the kicker—it's not linear like an EMA. You get cleaner signals with way less lag, and you can actually tune it to match your trading style.
The Aroon Oscillator is like a single dial that tells you whether the bulls or the bears are in control. It cuts through the noise by measuring the difference between upward and downward momentum, giving you a clearer picture of the market's current direction. Think of it as a simplified version of the two-line Aroon indicator, packed into one line that moves between -100 and +100. For any trader—whether you're in and out of trades in a day or holding for weeks—getting a handle on this oscillator can help you spot trend strength and possible turning points more easily.
Ever stared at your ATR indicator wondering what the heck 0.00125 means for your EUR/USD trade? You're not alone. Your broker talks in pips, your risk calculator needs pips, but your volatility indicator speaks in decimals that make no sense at 2 AM when you're trying to set a stop loss.
Here's the thing—ATR is brilliant for measuring market volatility, but it's useless for forex traders who think in pips. That's exactly why the ATR Pips indicator exists. It takes that confusing decimal and turns it into something you can actually use: real pip values that make sense for your trading decisions.

Automated trading on TradingView is like setting up a smart assistant for your trading. You give it a clear set of instructions, and it can watch the markets and act for you, even when you're not at your screen. The real magic happens by connecting TradingView's incredible charts with other specialized services that handle the actual trade execution.
Think of TradingView as your strategy design studio. It's where you build, test, and fine-tune your trading ideas. While it doesn't place the trades directly, it gives you all the tools to create the signals and then send them out into the world to get executed.
Automatic stop-loss and take-profit indicators on TradingView have completely changed the game for traders looking to manage risk and lock in gains without being glued to their screens. Think of them as your personal trading assistant; they use smart calculations and market analysis to set exit points that move with the market. This lets you stick to your trading plan, saves you a ton of time, and, most importantly, helps take the emotion out of your decisions.