Displaying Values with Pine Script: A Comprehensive Guide
Pine Script is a powerful programming language developed by TradingView, allowing users to create custom indicators and strategies for financial markets. One common requirement for traders and analysts is to display specific values without cluttering the chart. This article will guide you through how to effectively display values using Pine Script, ensuring your charts remain clean and informative.
Why Display Values in Pine Script?
Displaying values in Pine Script can be crucial for several reasons:
- Enhanced Analysis: By showing key indicator values directly on the chart, you can quickly analyze market conditions without needing to refer to additional windows or tools.
- Customization: Pine Script allows you to tailor your charts to your specific needs, making it easier to focus on the data that matters most to your trading strategy.
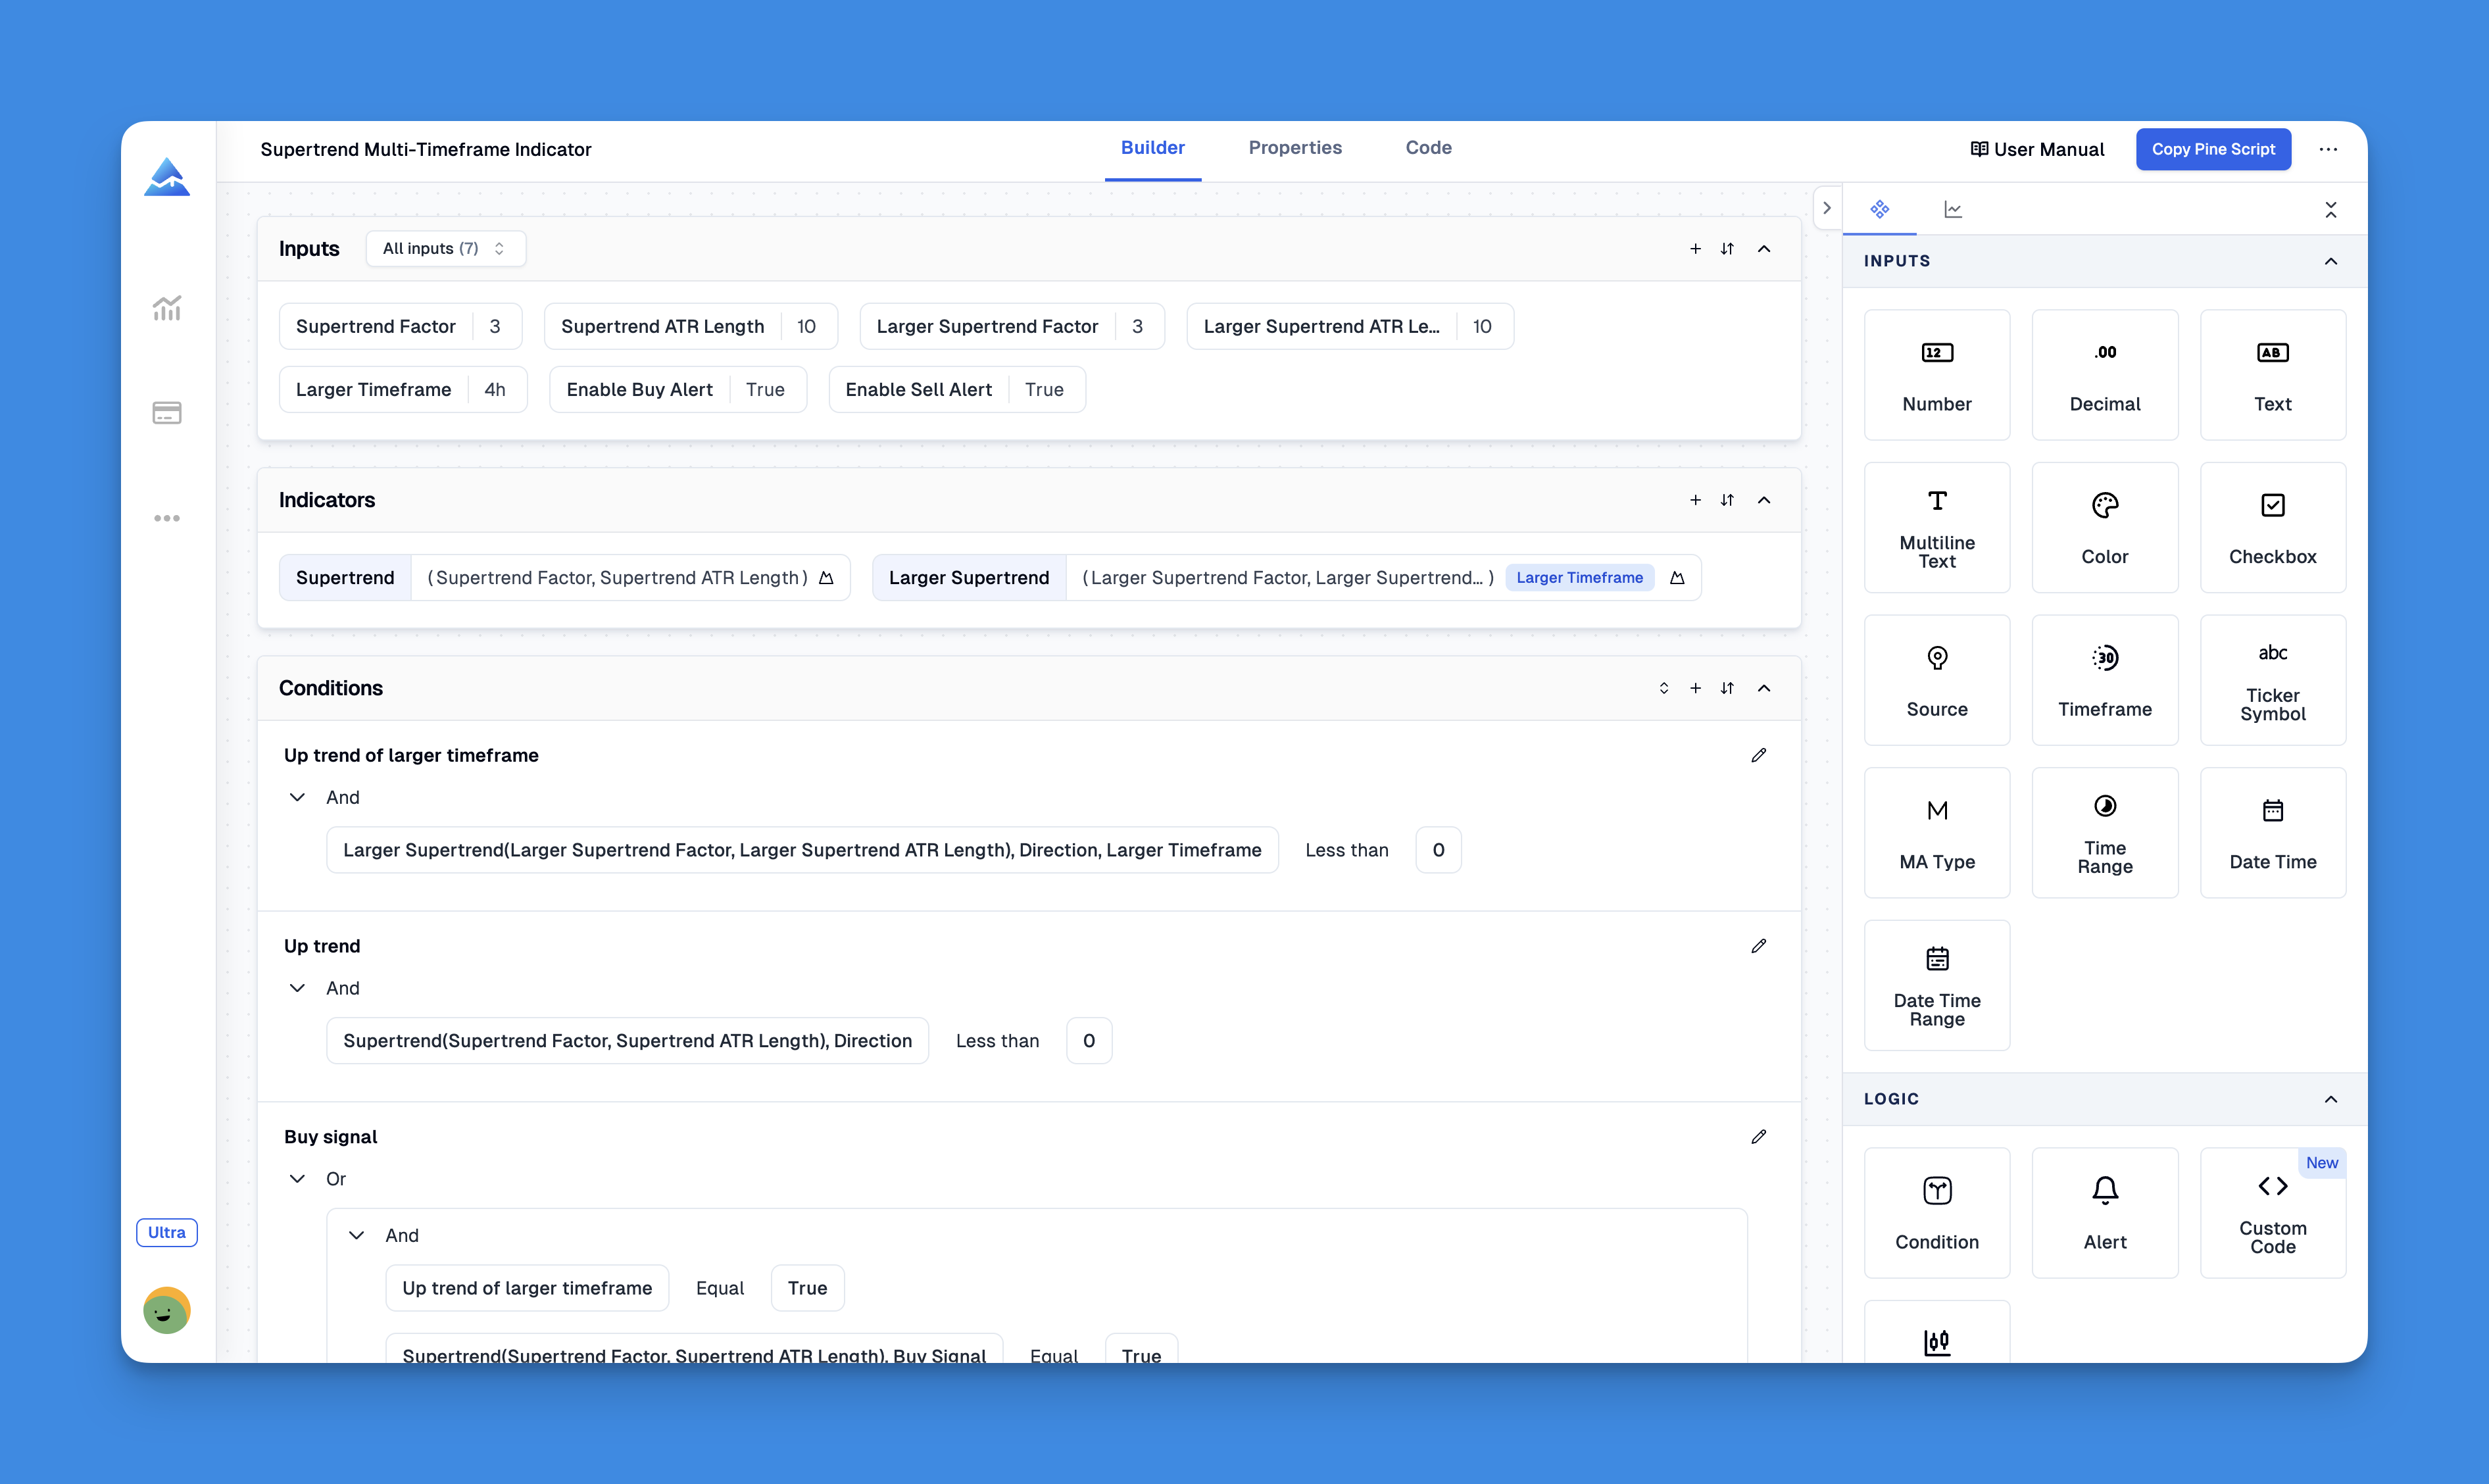
Enhancing Value Display with Pineify's No-Code Solutions
Pineify revolutionizes how traders implement value visualization in Pine Script through its intuitive platform. The tool enables users to bypass TradingView's two-indicator limit, allowing unlimited technical indicators on charts while maintaining clear value displays through customizable plots. This solves a critical pain point for analysts needing multiple concurrent data points without cluttering their workspace.

Website: Pineify
Click here to view all the features of Pineify.How to Display Values in Pine Script

To display values without plotting them on the chart, you can use the plotchar() function or manipulate the plot() function with specific settings. Here are some methods:
Using plotchar()
The plotchar() function allows you to display a character (which can be an empty string) at a specific location on the chart. This method is useful for keeping your chart clean while still showing important values.
// This source code is subject to the terms of the Mozilla Public License 2.0 at https://mozilla.org/MPL/2.0/
// © Pineify

//======================================================================//
//                    ____  _            _  __                          //
//                   |  _ \(_)_ __   ___(_)/ _|_   _                    //
//                   | |_) | | '_ \ / _ \ | |_| | | |                   //
//                   |  __/| | | | |  __/ |  _| |_| |                   //
//                   |_|   |_|_| |_|\___|_|_|  \__, |                   //
//                                             |___/                    //
//======================================================================//
// @version=6
indicator(title="[Pineify - Best Pine Script Generator]ADR %", overlay=true)

length = input(20, title="length")

dhigh = request.security(syminfo.tickerid, 'D', high)
dlow = request.security(syminfo.tickerid, 'D', low)
adr = 100 * (ta.sma(dhigh/dlow, length) - 1)

plotchar(adr, title="ADR %", char="", location=location.top)
Using plot() with Transparency
Another approach is to plot the value but set its transparency to 100%, effectively hiding it from view while still displaying its value in the indicator title.
// This source code is subject to the terms of the Mozilla Public License 2.0 at https://mozilla.org/MPL/2.0/
// © Pineify

//======================================================================//
//                    ____  _            _  __                          //
//                   |  _ \(_)_ __   ___(_)/ _|_   _                    //
//                   | |_) | | '_ \ / _ \ | |_| | | |                   //
//                   |  __/| | | | |  __/ |  _| |_| |                   //
//                   |_|   |_|_| |_|\___|_|_|  \__, |                   //
//                                             |___/                    //
//======================================================================//
// @version=6
indicator(title="[Pineify - Best Pine Script Generator]ADR %", overlay=true)

length = input(20, title="length")

dhigh = request.security(syminfo.tickerid, 'D', high)
dlow = request.security(syminfo.tickerid, 'D', low)
adr = 100 * (ta.sma(dhigh/dlow, length) - 1)

plot(adr, title="ADR %", color=color.new(color.white, 100))
Tips for Effective Pine Script Development
- Keep It Simple: Ensure your scripts are easy to read and maintain by using clear variable names and concise logic.
- Test Thoroughly: Always test your scripts with different market conditions to ensure they behave as expected.
- Customize for Your Needs: Use Pine Script to tailor your charts to your specific trading strategy, focusing on the data that matters most.
Conclusion
Displaying values in Pine Script can significantly enhance your trading experience by providing quick access to critical information without cluttering your charts. Whether you’re a seasoned trader or just starting out, mastering Pine Script can help you make more informed decisions.
Use Pineify to create custom Pine Script indicators without coding. Our no-code platform helps you:
- Generate professional-grade Pine Script code instantly
- Bypass TradingView's indicator limits
- Create custom indicators with intuitive visual tools
- Save time and focus on what matters - your trading strategy
Start building your custom indicators today with Pineify's easy-to-use platform.