How to Code an EMA Crossover Pine Script for Trading
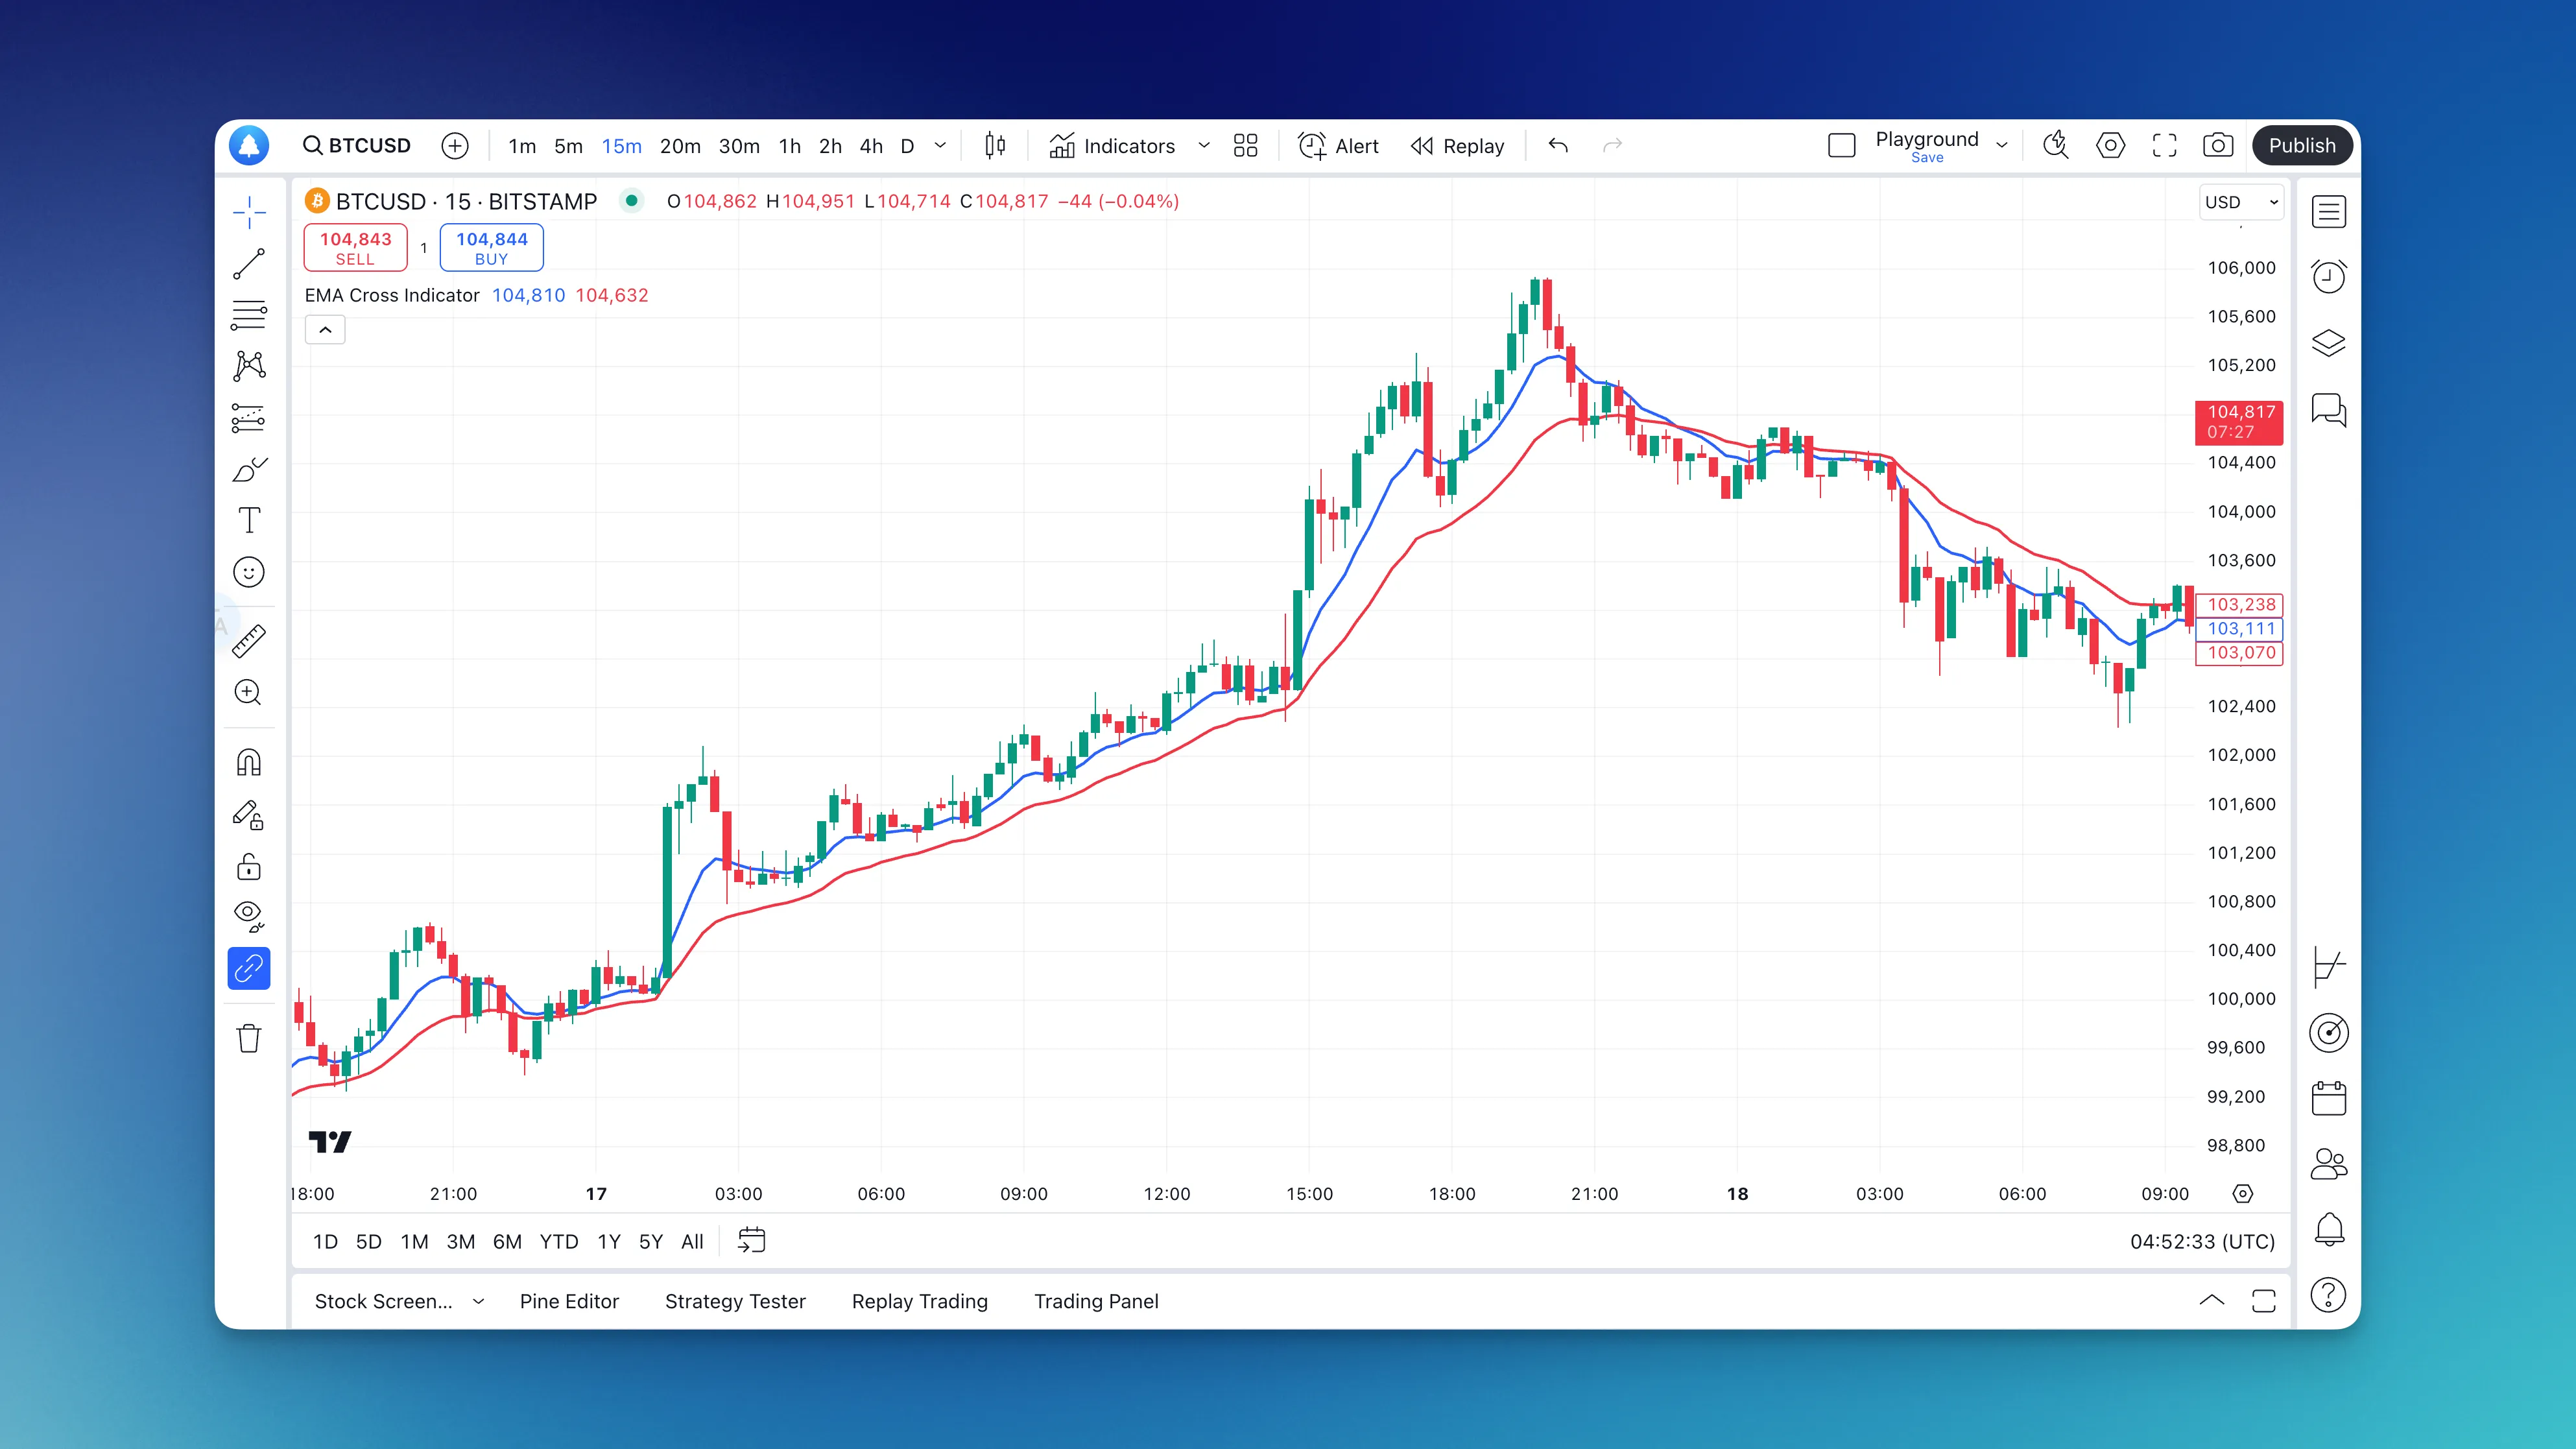
An EMA crossover is a trading signal that happens when a shorter-period exponential moving average crosses above or below a longer-period one. The fast EMA reacts to recent price changes, while the slow EMA provides a smoother baseline. When they cross, you're seeing a momentum shift in real time. This is one of my go-to indicators because it balances simplicity with effectiveness — I've used it on AAPL, TSLA, and SPY with consistent results.
What's an EMA Crossover Strategy Actually About?

Picture this: you've got two exponential moving averages on your chart. One fast (shorter period), one slow (longer period). When the fast EMA crosses above the slow EMA, it often signals upward momentum — a potential buy. When it crosses below, momentum might be shifting downward.
The fast EMA responds quickly to recent price changes, while the slow EMA gives a smoother baseline. When they cross, you're seeing a conversation between short-term and long-term market sentiment.
Why EMAs Beat Simple Moving Averages
Here's something that took me a while to figure out: EMAs give more weight to recent prices. Unlike simple moving averages that treat all data points equally, EMAs react faster to price changes while still filtering out some noise. You get signals sooner without getting whipsawed every few minutes.
When I first started trading, I used simple moving averages and constantly got frustrated by how slow they were. EMAs changed that for me — responsive enough to catch moves early, smooth enough to avoid most false signals. I still prefer EMAs over SMAs for any short-to-medium-term setup.
The EMA Settings That Actually Work in Real Trading
After testing countless combinations (and losing money on some pretty bad setups), here's what I've found works consistently:
For Day Trading:
- Fast EMA: 9 periods
- Slow EMA: 21 periods
- Timeframe: 5-minute or 15-minute charts
For Swing Trading:
- Fast EMA: 12 periods
- Slow EMA: 26 periods
- Timeframe: Daily charts
For Long-term Position Trading:
- Fast EMA: 20 periods
- Slow EMA: 50 periods
- Timeframe: Weekly charts
These aren't random numbers — they're based on market cycles and what other traders watch. When everyone's looking at similar levels, those levels become more significant.
Building Your EMA Crossover With Pineify
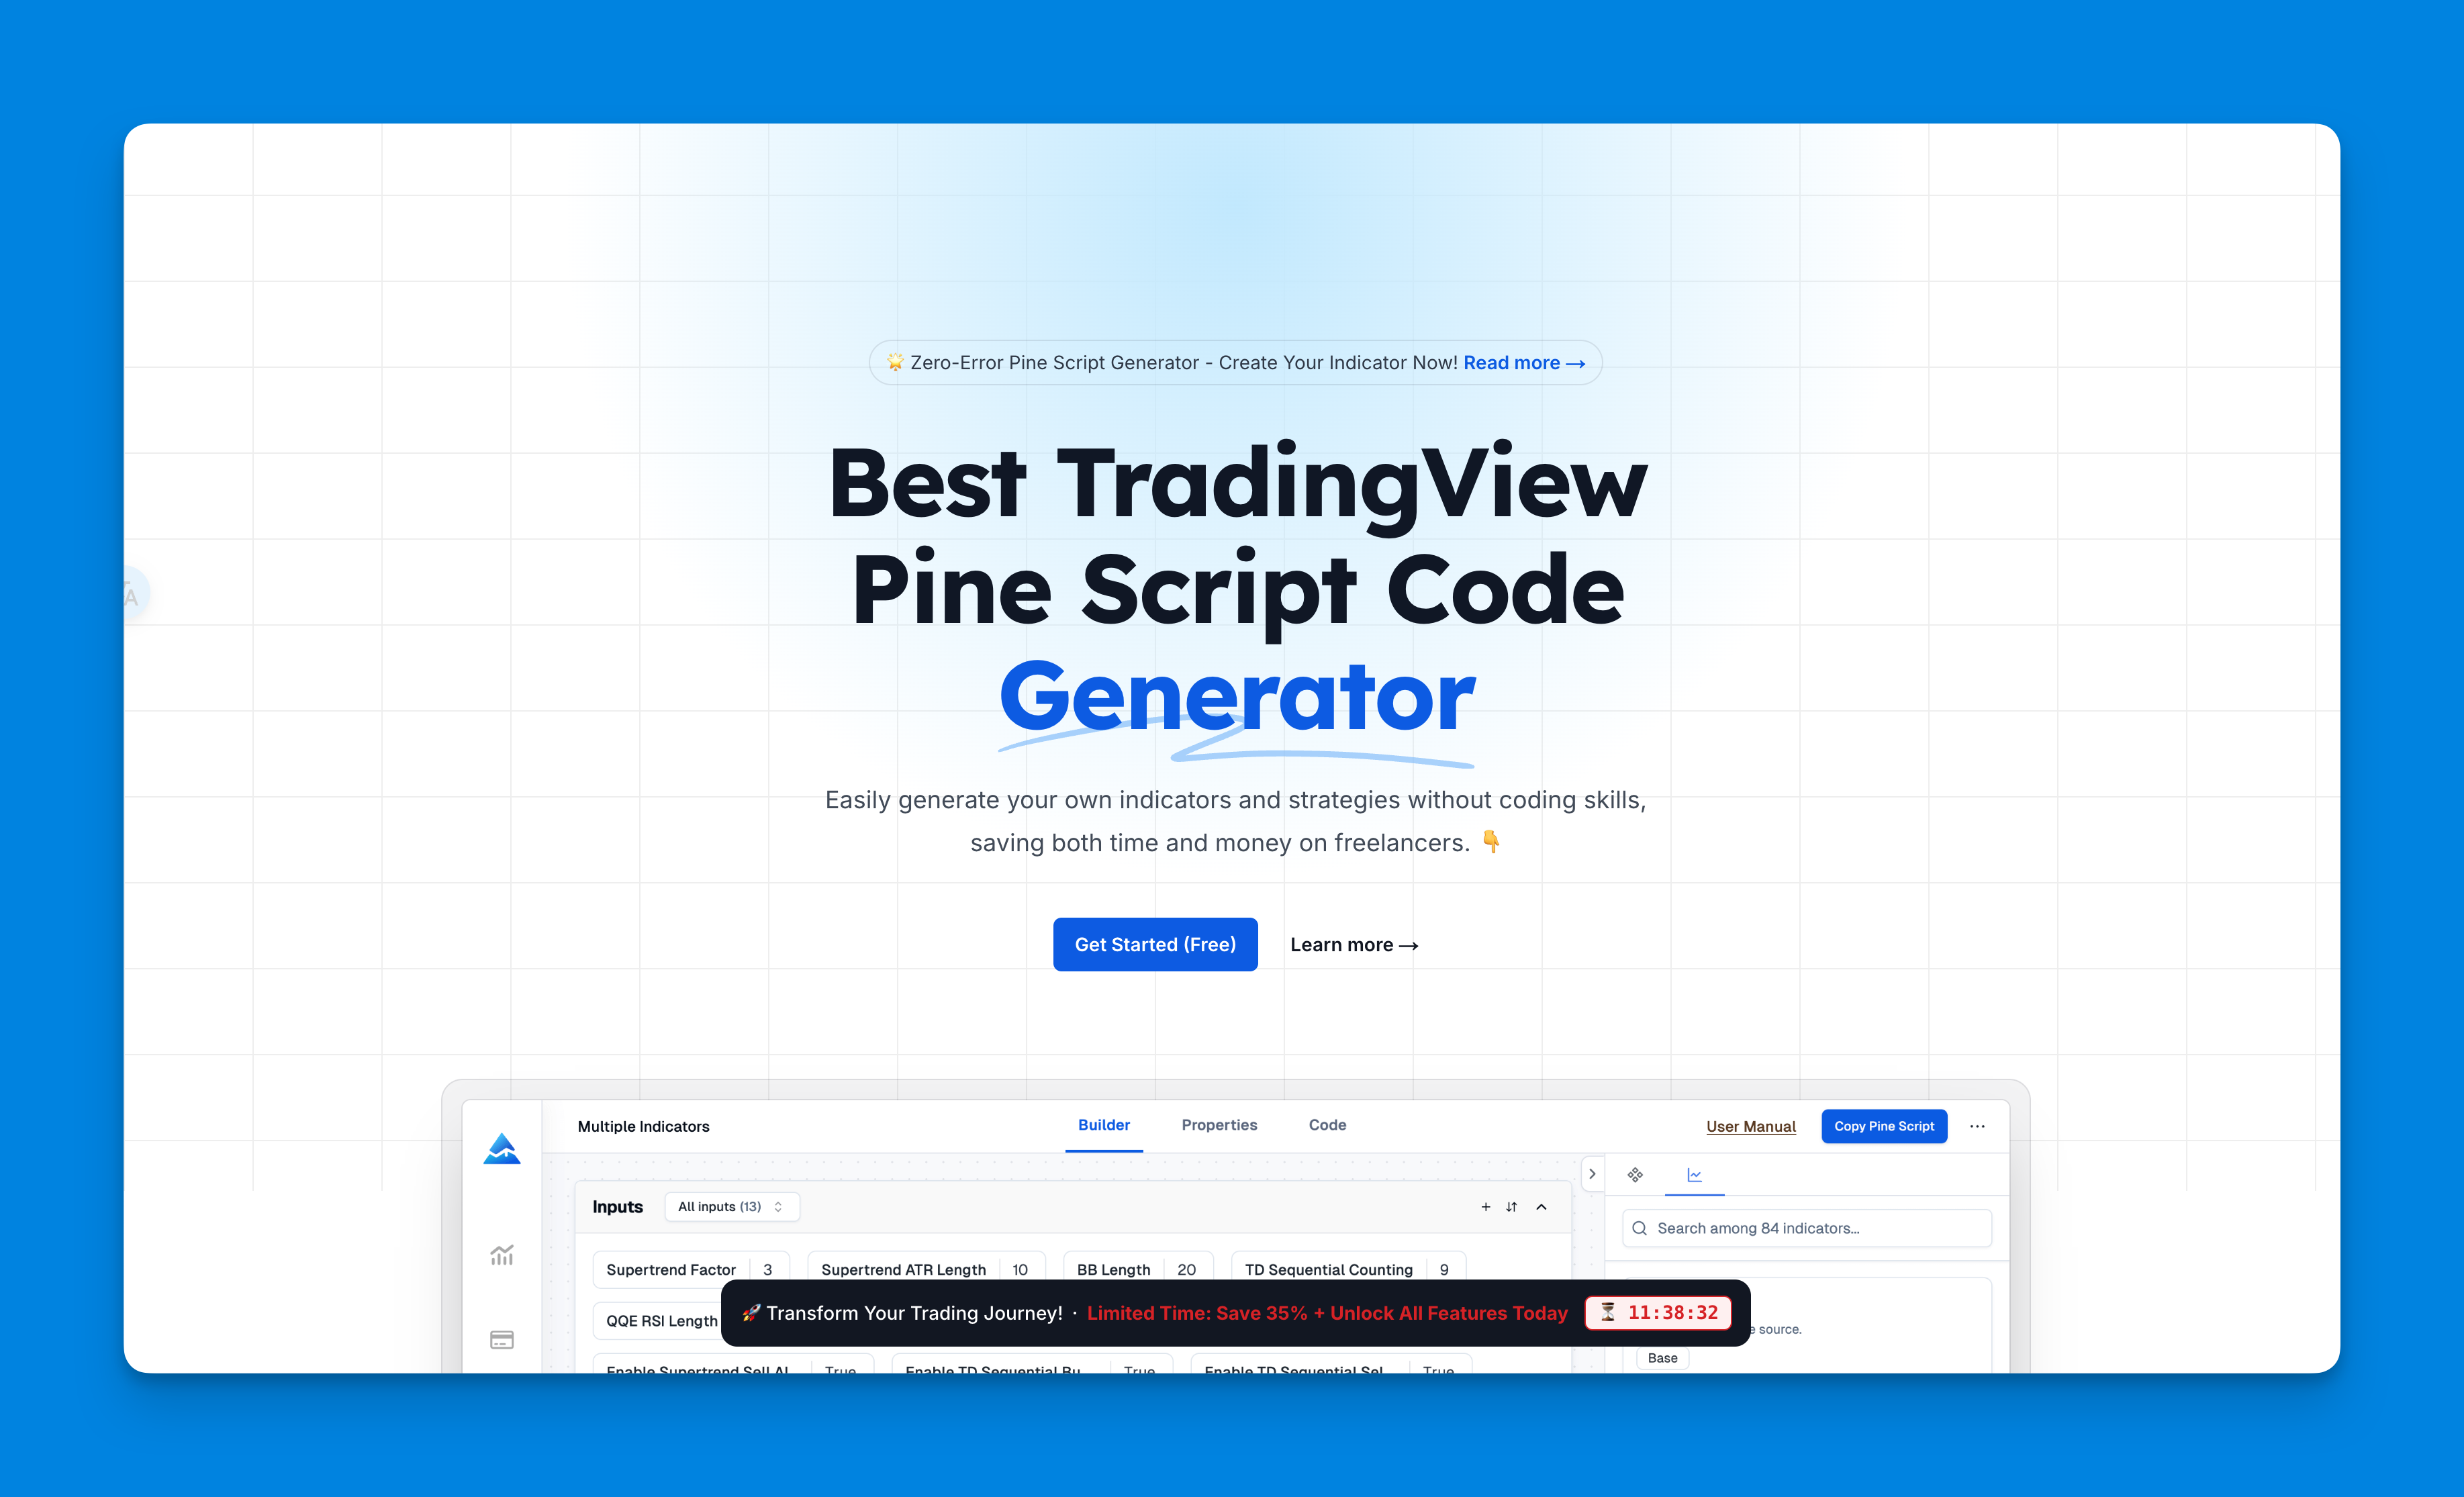
I used to spend hours debugging Pine Script errors. TradingView's free plan limits you to 3 indicators, and learning Pine Script from scratch while trying to trade gets old fast. Pineify solves this — it's a visual Pine Script builder where you edit components, set parameters, and get clean, working code. No syntax errors, no debugging nightmares.
What I like about it: the visual interface works like building blocks, the real-time preview shows your indicator before code generation, and the output is readable if you want to tweak it later. One limitation I've found — if you need extremely custom logic that doesn't fit the visual components, you'll still need to write some Pine Script to supplement. But for 90% of EMA crossover setups, it handles everything.
If you're exploring automated Pine Script generation, The Ultimate AI Pine Script Generator covers it in more detail.
Step-by-Step: Building Your EMA Crossover Indicator
Here's exactly how I set up my EMA crossover indicator, with the reasoning behind each step:
Phase 1: Getting Started With Pineify
-
Sign up for Pineify — takes about 30 seconds, no configuration needed.
-
Choose "Create New Indicator" from the dashboard.
-
Select the EMA Crossover template or start from scratch if you want full control. Why: starting with a template saves time on boilerplate EMA logic. What can go wrong: templates often include extra settings you don't need — strip those out to keep your code clean.
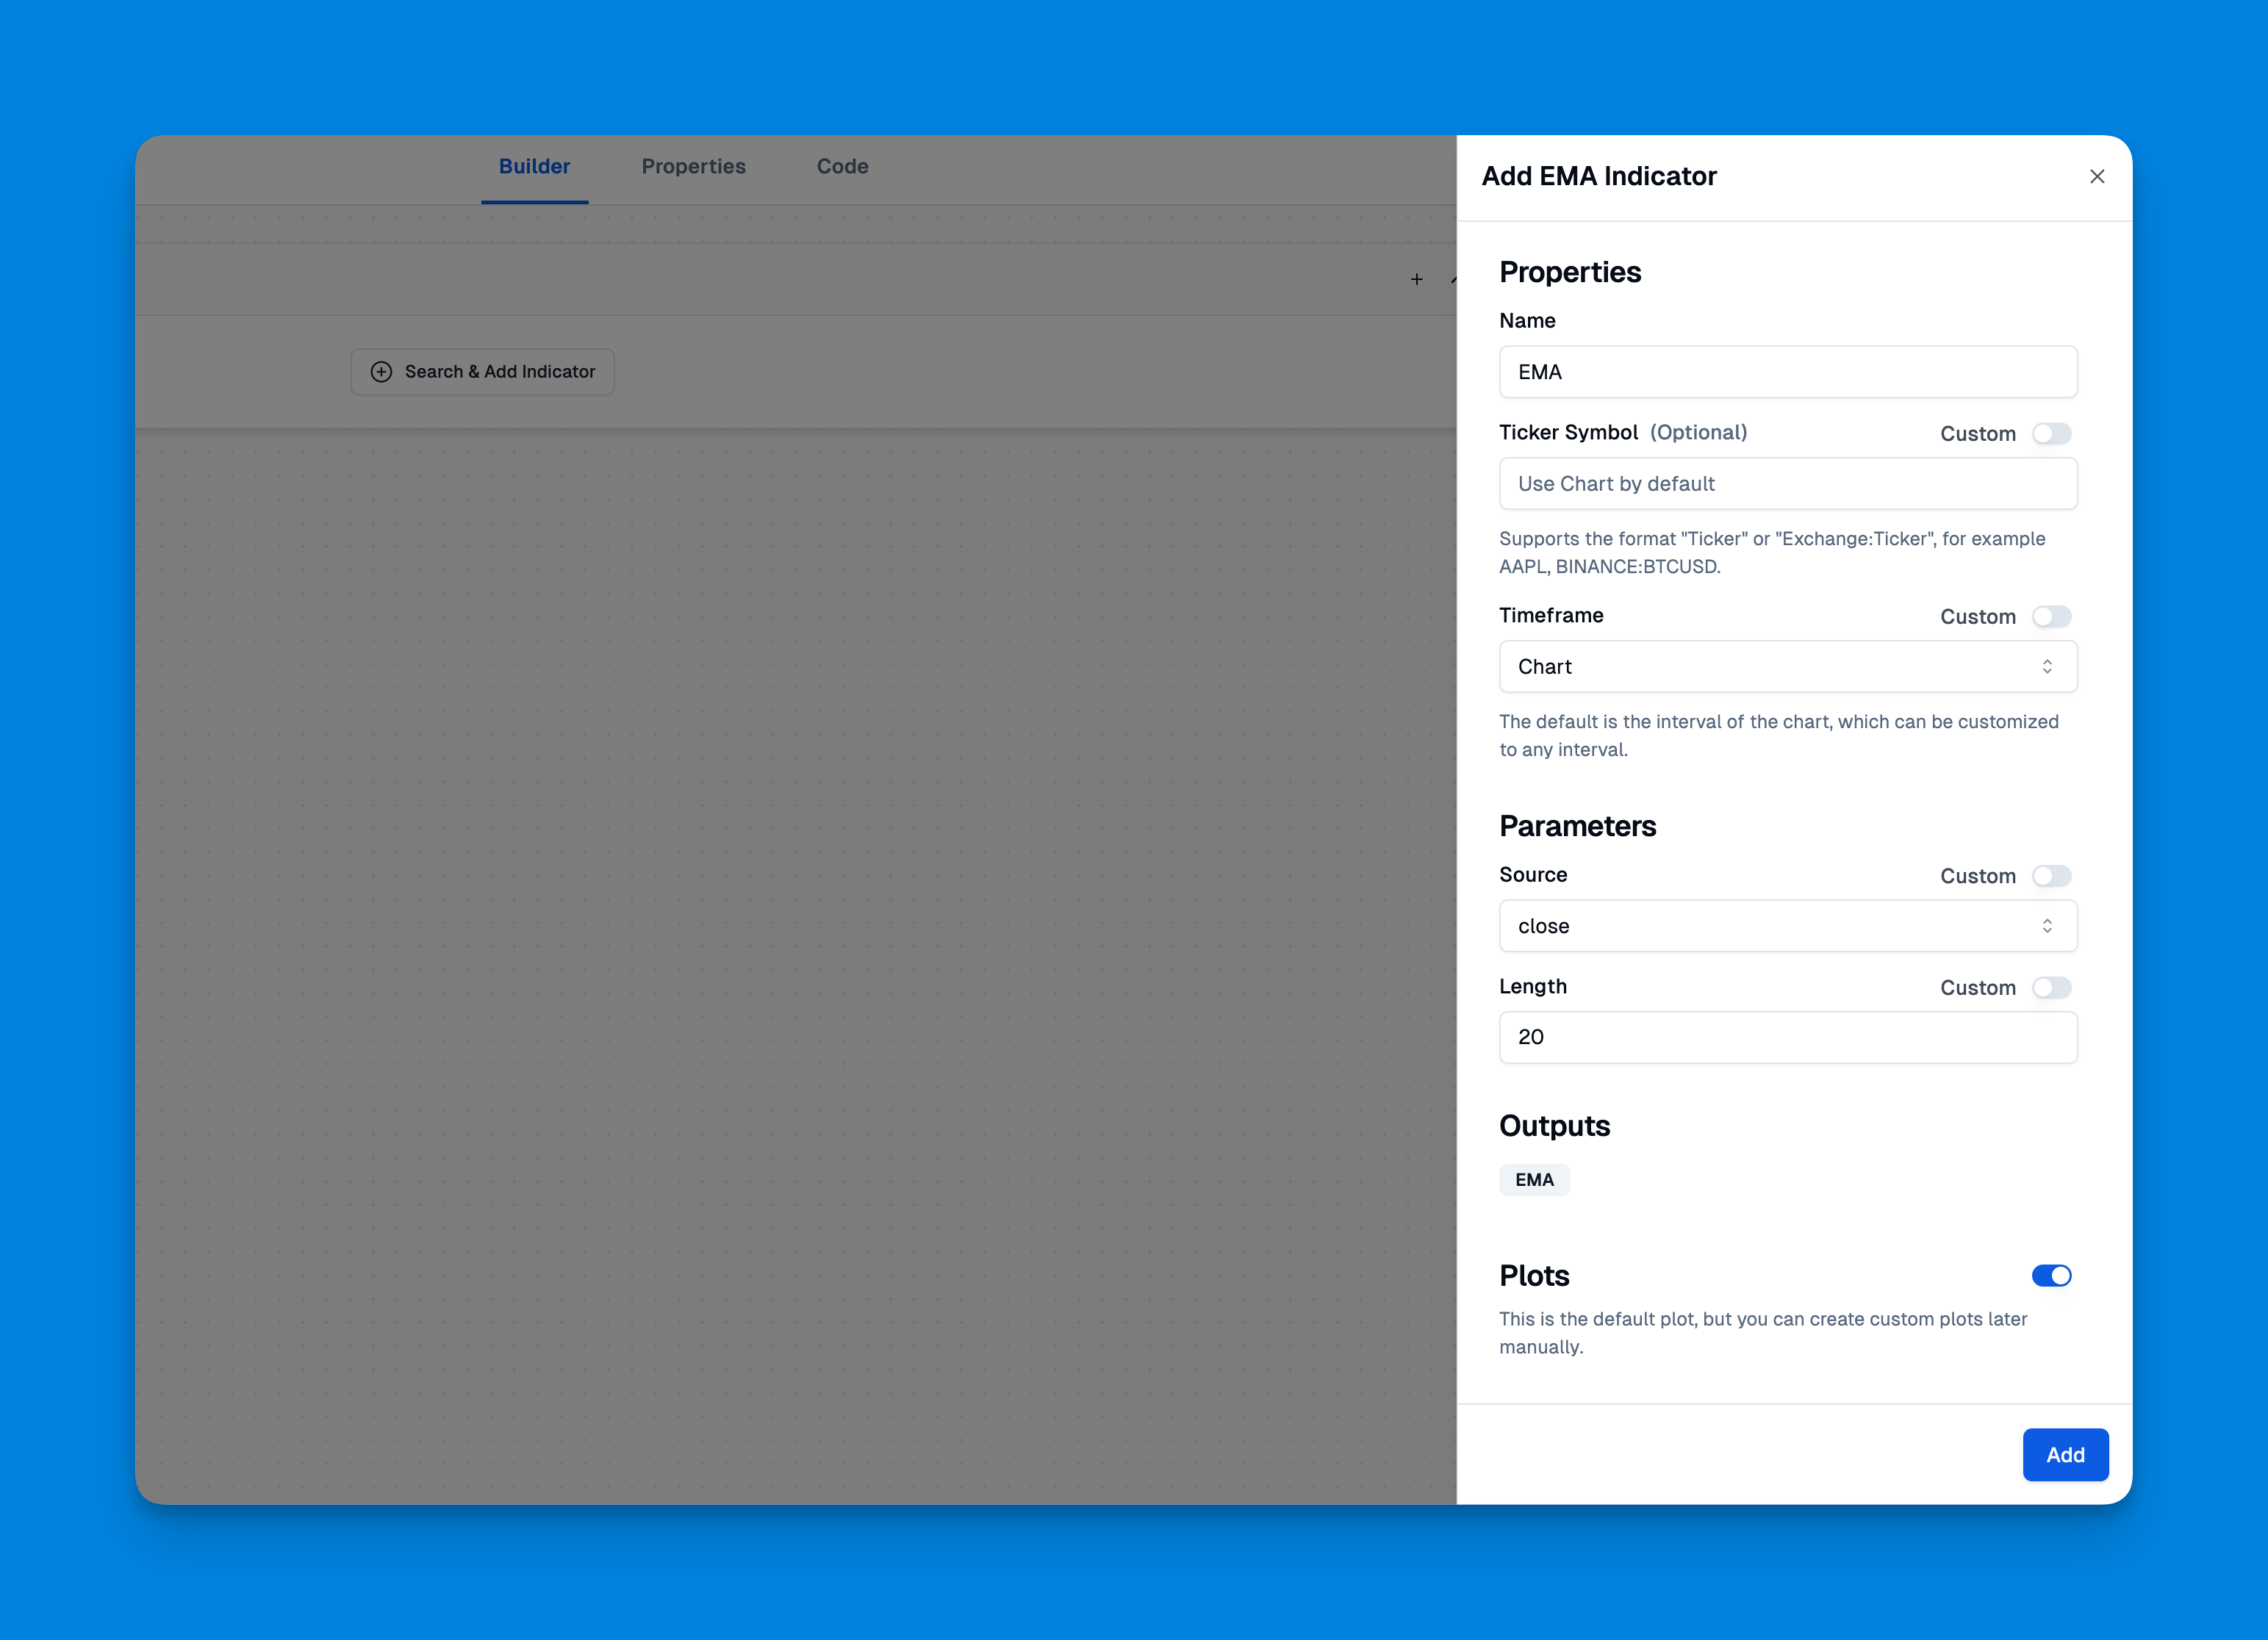
Phase 2: Configuring Your EMAs
-
Add your first EMA:
- Set the period to 9 (fast EMA). Why: 9 and 21 are the most widely watched EMA levels, making them self-reinforcing. What can go wrong: in very volatile stocks like TSLA, a 9-period EMA might whip too much — you might need to widen it to 10 or 12.
- Choose a bright color like blue or green.
- Set the line thickness to 2 for visibility.
-
Add your second EMA:
- Set the period to 21 (slow EMA).
- Pick a contrasting color like red or orange.
- Keep the same line thickness so one doesn't dominate the chart.
-
Add crossover signals:
- Enable buy/sell arrows.
- Set them to appear only on confirmed crossovers. Why: this reduces false signals from price wiggles near the crossover point. What can go wrong: if you only allow confirmed crossovers, you'll enter later — sometimes missing the first 1-2% of a move on fast stocks like NVDA.
Phase 3: Fine-Tuning and Testing
Before trading with any indicator, test it thoroughly. Use TradingView's replay feature to see how your EMA crossover would have performed in different market conditions. Why: historical testing catches flaws in your settings. What can go wrong: over-optimizing to past data — if you tweak settings until they look perfect on a 2023 backtest, they'll probably fail in 2024.
Real-World Trading With EMA Crossovers
I don't blindly follow every crossover signal — that's a recipe for disaster. Here's the systematic approach I use:
My Pre-Trade Checklist
Market Context:
- What's the overall trend on higher timeframes?
- Are we in a trending or ranging market?
- Any major news events coming up?
Technical Confirmation:
- Is the crossover happening near a significant support/resistance level?
- What's the volume like? Higher volume = more reliable signal.
- Are other indicators confirming the signal?
For additional confirmation, I often reference Moving Average Ribbon strategies to get a broader view of trend strength.
Risk Management Rules I Never Break
- Position Size: Never risk more than 2% of my account on a single trade. On a $10k account, that means my maximum loss per trade is $200.
- Stop Loss: Always set before entering the trade, not after. I usually place it 1-2 ATR below the crossover point.
- Take Profit: Have a target in mind, but stay flexible with market conditions.
- Time Limits: If a trade doesn't move in my favor within 3-5 bars, I reconsider the entry.
When EMA Crossovers Work Best
Trending Markets: This is where EMA crossovers shine. In strong trends, crossovers often mark the beginning of significant moves. I caught a nice run on META in October 2023 using a 12/26 daily crossover.
After Consolidation: When price has been moving sideways and then breaks out with an EMA crossover, those signals tend to be more reliable.
Higher Timeframes: Crossovers on daily charts are more significant than those on 5-minute charts. I've tested this — the win rate on daily crossovers is roughly 15-20% higher for swing trades.
When to Avoid EMA Crossover Signals
Choppy Markets: In sideways, range-bound markets, you'll get whipsawed constantly. I avoid EMA crossovers when the ADX is below 20.
Low Volume: Crossovers with minimal volume often lead to false breakouts. I check the volume indicator before entering.
Around Major News: Economic announcements can cause erratic price movements that invalidate technical signals.
Advanced EMA Crossover Techniques
Once you're comfortable with basic crossovers, here are a few ways to enhance the strategy:
Multiple Timeframe Analysis
I check what the EMA crossover is doing on three different timeframes:
- Entry timeframe (where I place the trade)
- Confirmation timeframe (one level higher)
- Trend timeframe (two levels higher)
When all three timeframes align, the success rate improves noticeably. I've seen this work on SPY daily/weekly/monthly setups.
Combining With Other Indicators
EMA crossovers work great as part of a larger system. I often combine them with:
- RSI for momentum confirmation — I prefer the RSI above 50 for long signals
- MACD for additional trend verification
- Volume indicators to confirm the strength of moves
If you're interested in building more complex multi-indicator strategies, How to Combine Two Indicators in TradingView Pine Script provides solid guidance.
Dynamic EMA Periods
Instead of fixed periods like 9 and 21, some traders adjust their EMA periods based on market volatility. Higher volatility = shorter periods, lower volatility = longer periods. I haven't tested this approach extensively, so I can't vouch for it personally, but some experienced traders on TradingView swear by it.
Common Mistakes (And How I Learned to Avoid Them)
Mistake #1: Following Every Signal. I thought every crossover was a golden opportunity early on. Wrong. Quality over quantity always wins.
Mistake #2: Ignoring Market Context. Technical signals in isolation are dangerous. Always consider what's happening in the broader market. I ignored the November 2023 rally context and took bearish crossovers that got crushed.
Mistake #3: Moving Stop Losses Against You. Once you set a stop loss, stick to it. Moving it further away "just this once" usually leads to bigger losses.
Mistake #4: Overcomplicating the Strategy. Don't add so many filters that you miss good opportunities. I've been guilty of stacking five indicators and getting no signals at all for days.
Backtesting Your EMA Crossover Strategy
Before risking real money, spend time backtesting your approach. TradingView's Strategy Tester is perfect for this. Look for:
- Win Rate: What percentage of trades are profitable? I aim for at least 40% with a 2:1 reward-to-risk ratio.
- Risk/Reward Ratio: Are your winners bigger than your losers?
- Maximum Drawdown: How much could you lose during bad streaks? If it's over 20%, your settings are too aggressive.
- Consistency: Does the strategy work across different market conditions? Test on 2022 bear market and 2023 bull market separately.
For a deeper look at backtesting strategies, Backtest Indicator TradingView offers detailed guidance on strategy testing.
EMA crossovers aren't magic, but they're reliable when used properly. No single indicator works in isolation — successful trading comes from combining technical analysis with solid risk management and market awareness.
Start with paper trading to get comfortable with the signals. Once you're consistently profitable in simulation, gradually transition to live trading with small position sizes. The goal isn't to get rich quick �— it's to build a sustainable, profitable trading approach over time.
The EMA crossover strategy has been around for decades because it works. With modern tools making it easier to implement and customize, there's no excuse not to give it a proper try.
The best trading strategy is the one you understand, test thoroughly, and execute consistently. EMA crossovers might just be that strategy for you.
▶What is the best EMA crossover setting for day trading?
For day trading, I've found a fast EMA of 9 periods and a slow EMA of 21 periods on 5-minute or 15-minute charts works best. These aren't arbitrary — they're widely watched by other traders, which makes them more significant.
▶How do I add an EMA crossover indicator without writing code?
Use Pineify — it's a visual builder where you pick EMA periods, colors, and signal types through a drag-and-drop interface. It generates clean code you can publish to TradingView. No coding needed.
▶When does an EMA crossover give a buy signal?
A buy signal fires when the fast EMA crosses above the slow EMA. I trust the signal more when it happens near a support level, shows higher volume, and lines up with the trend on higher timeframes.
▶How do I avoid false EMA crossover signals?
Skip crossovers in sideways markets and low-volume periods — that's where most false signals live. Add confirming indicators like RSI or MACD, and always check a higher timeframe before entering.
▶Can I backtest an EMA crossover strategy on TradingView?
Yes. TradingView's Strategy Tester lets you replay historical data and evaluate your signals. Look at win rate, risk-to-reward ratio, and maximum drawdown — not just total profit.
▶What is the difference between EMA crossover and SMA crossover?
EMAs react faster because they weight recent prices more heavily. That means earlier signals with less lag, but slightly more false signals in choppy markets compared to SMAs. I prefer EMAs for momentum, SMAs for range-bound conditions.