Custom EMA Multi-Timeframe Indicator: A Trader's Essential Tool for Analyzing Market Dynamics
The Custom EMA Multi-Timeframe Indicator is a versatile technical analysis tool designed to provide traders with a comprehensive view of market trends across multiple timeframes. By combining Exponential Moving Averages (EMAs) from short, medium, and long-term perspectives, this indicator offers valuable insights into potential trend changes and trading opportunities.
 👉 Copy Indicator Script
Key Features

- Utilizes three Exponential Moving Averages (EMAs) across different timeframes
- Generates buy and sell signals based on EMA crossovers
- Customizable timeframes and EMA lengths for each moving average
- Visual representation of EMAs and trading signals on the chart
- Automated alerts for buy and sell signals
How It Works
This indicator employs a sophisticated multi-timeframe approach using three Exponential Moving Averages:
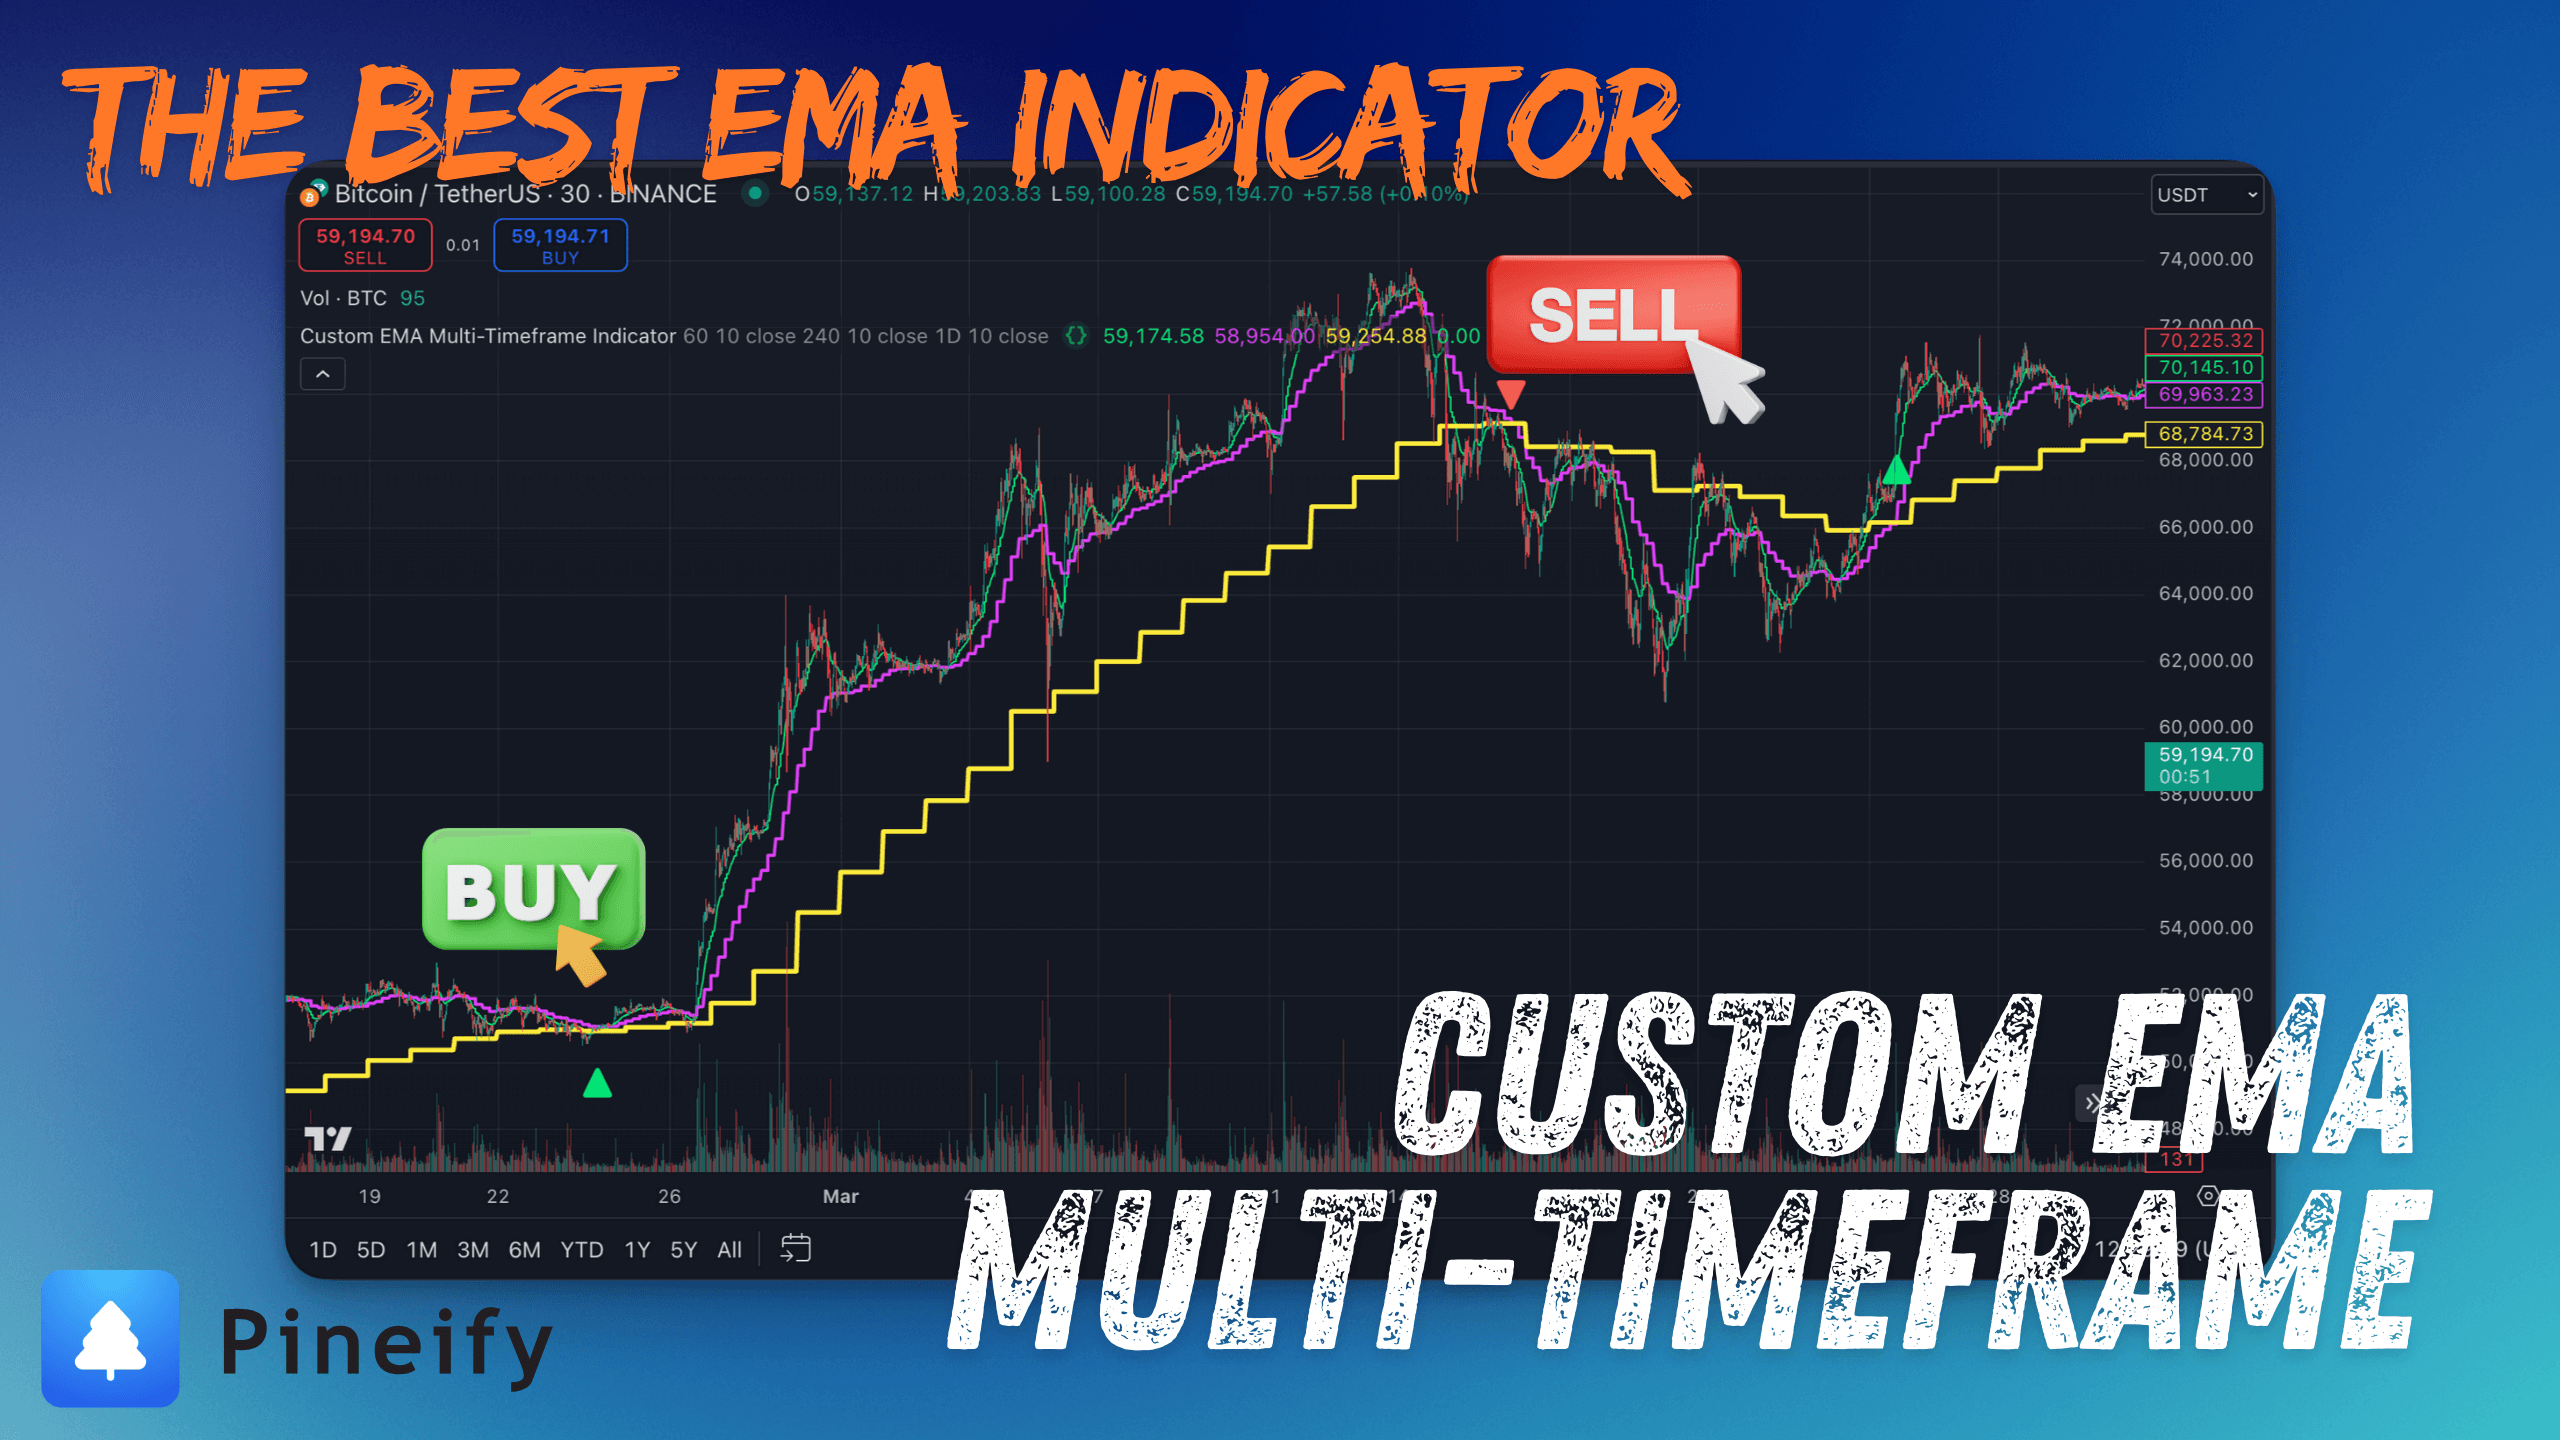
- Short-term EMA: Calculated on a shorter timeframe (default: 60 minutes)
- Medium-term EMA: Calculated on a medium timeframe (default: 240 minutes)
- Long-term EMA: Calculated on a longer timeframe (default: 1 day)
The indicator generates buy signals when both the short-term and medium-term EMAs cross above the long-term EMA. Conversely, sell signals are triggered when both the short-term and medium-term EMAs cross below the long-term EMA.
Trading Ideas and Insights
This multi-timeframe EMA indicator offers valuable insights for various trading strategies:
- Trend Confirmation: The alignment of EMAs across different timeframes provides strong confirmation of the overall trend direction.
- Entry and Exit Points: Buy signals can be used as potential entry points for long positions, while sell signals can indicate optimal exit points or opportunities for short positions.
- Market Sentiment Analysis: The relative positions of the three EMAs offer insights into market sentiment across different time horizons.
- Momentum Trading: The crossover of shorter-term EMAs over the longer-term EMA can indicate increasing momentum in a particular direction.
- Risk Management: Traders can use the long-term EMA as a dynamic stop-loss level, adjusting their positions when price action moves against the prevailing trend.
Unique Aspects
What sets this indicator apart is its multi-timeframe approach combined with customizable EMA settings. This allows traders to:
- Capture trends across different time horizons simultaneously
- Reduce false signals by confirming trends on multiple timeframes
- Adapt the indicator to various trading styles and market conditions
- Fine-tune the sensitivity of the indicator to match specific trading preferences
How to Use
- Apply the indicator to your chart
- Observe the three EMA lines (short, medium, and long)
- Watch for buy signals (green triangles) when short and medium EMAs cross above the long EMA
- Look for sell signals (red triangles) when short and medium EMAs cross below the long EMA
- Use these signals in conjunction with other technical analysis tools and your trading strategy
Customization
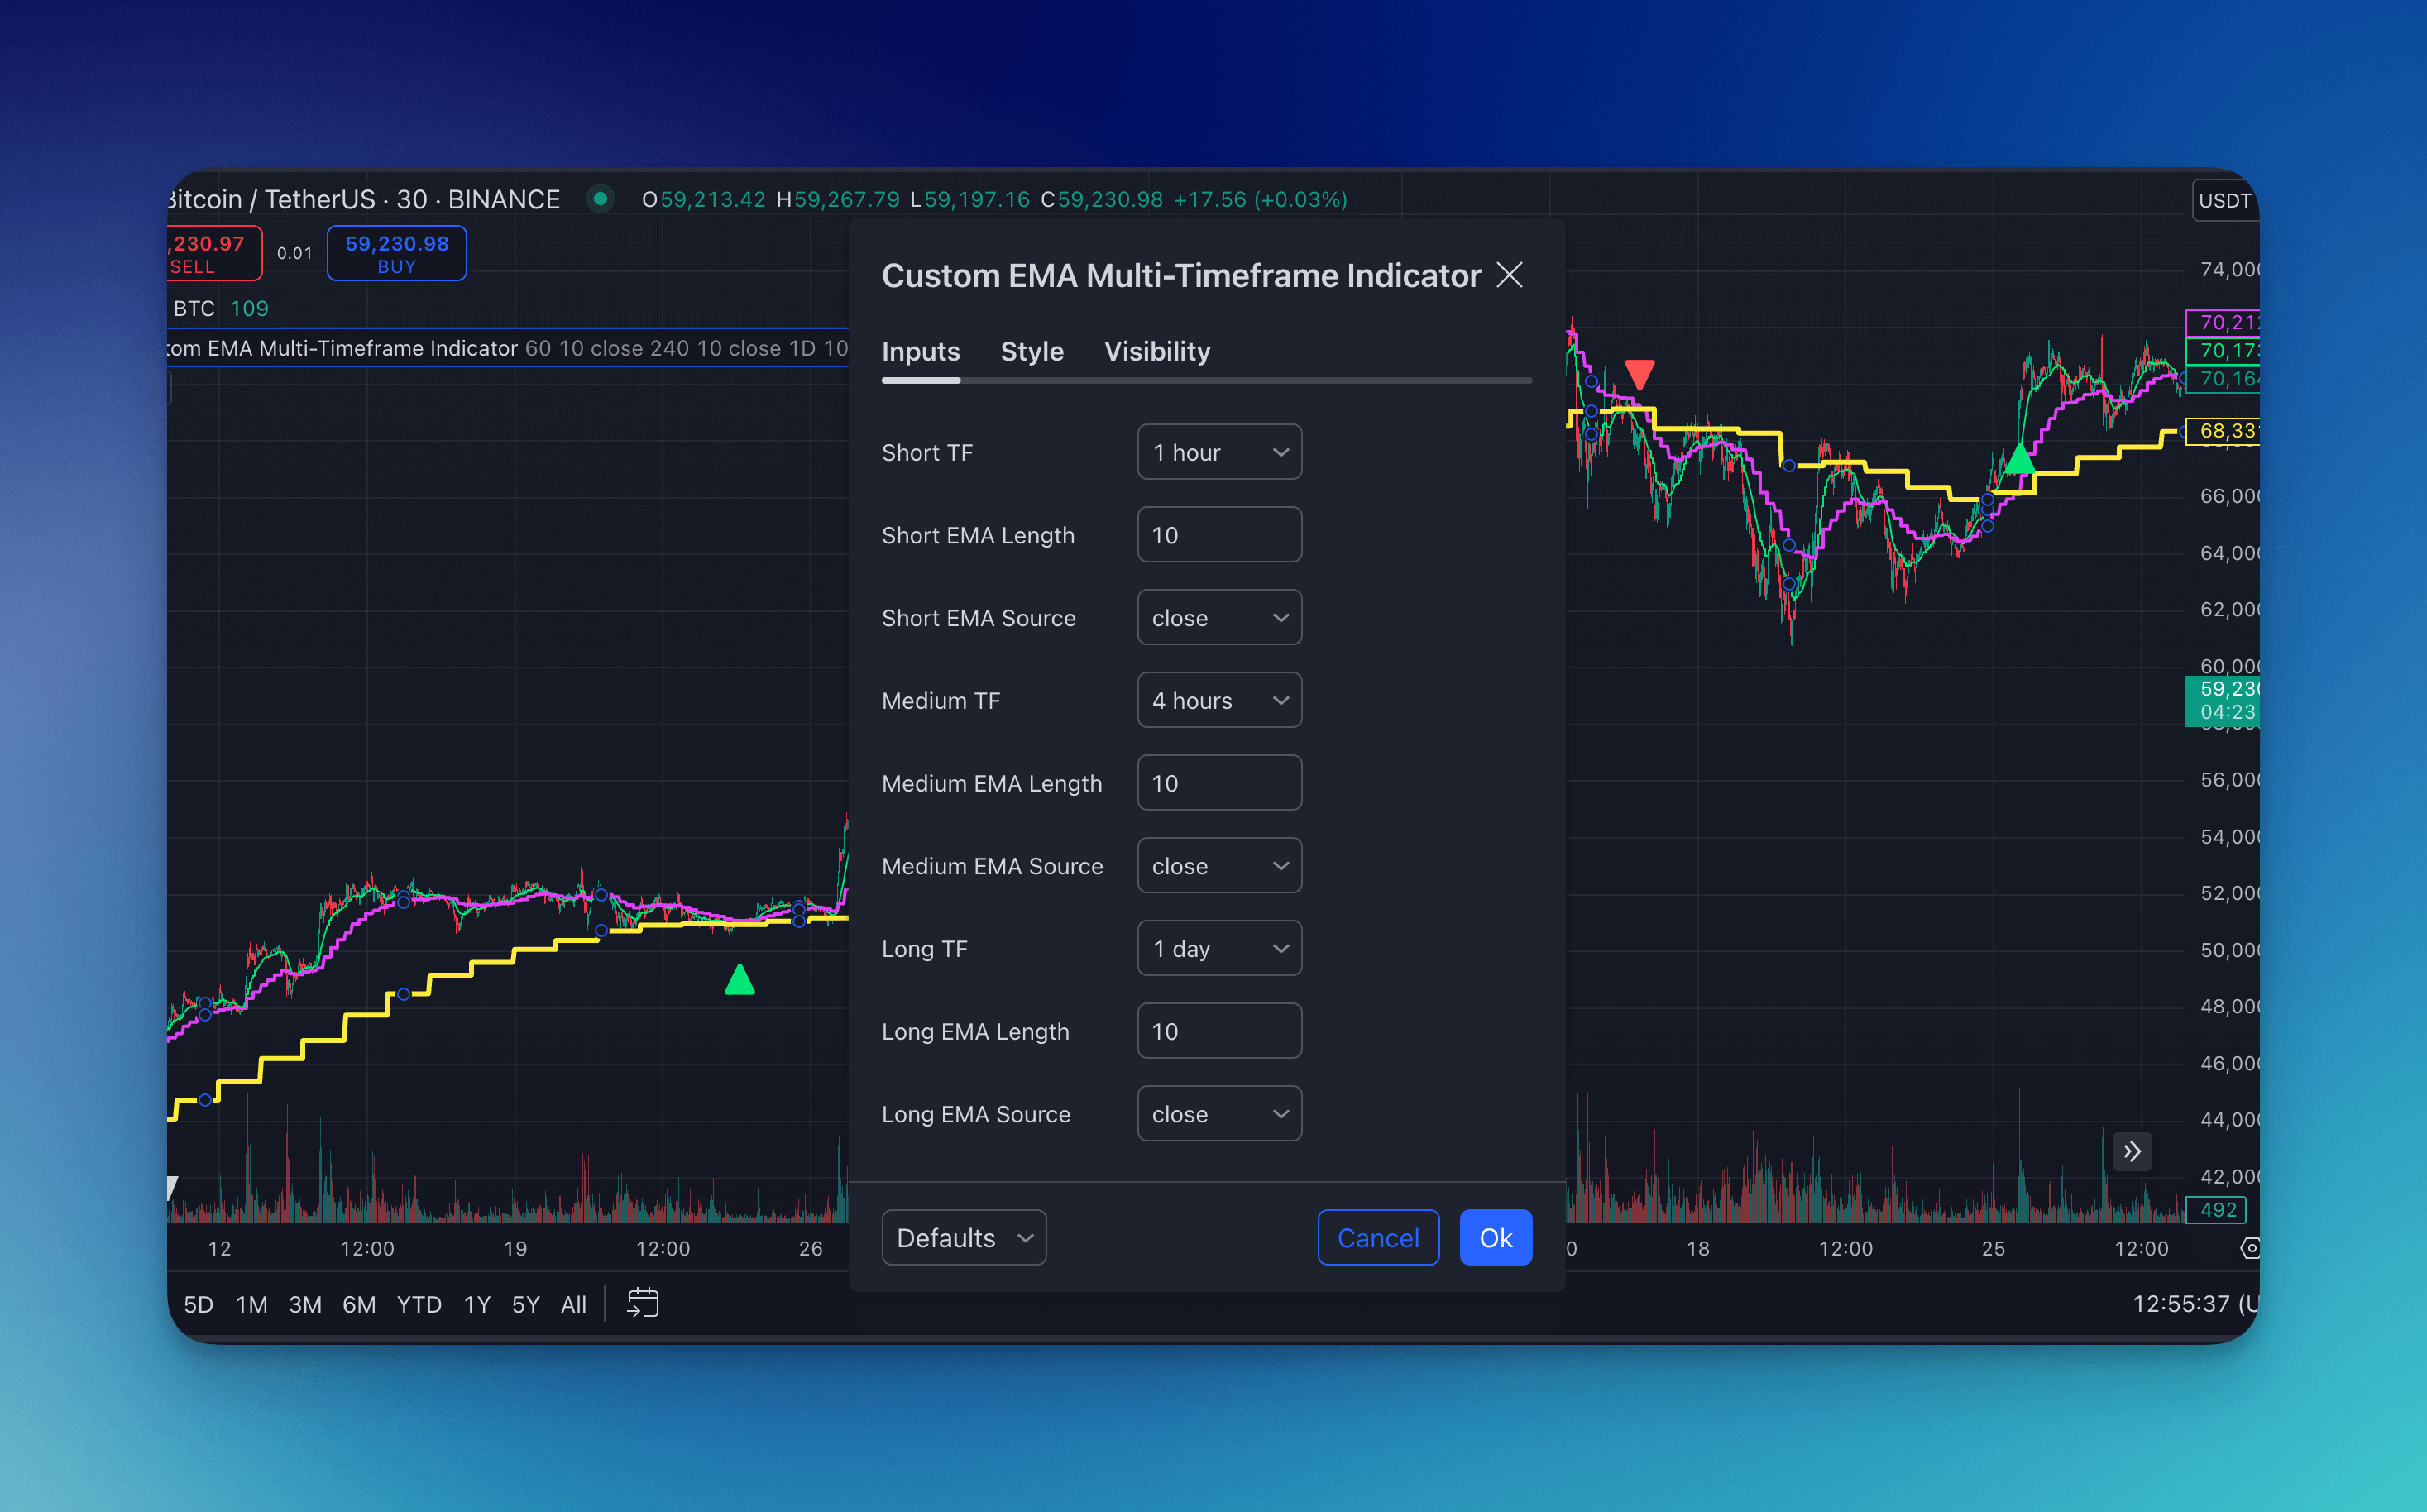
The indicator offers extensive customization options:
- Adjust timeframes for each EMA (short, medium, long)
- Modify EMA lengths to change sensitivity
- Select different price sources for EMA calculations (e.g., close, open, high, low)
- Customize colors and styles of EMA lines and signal markers
Conclusion
The Custom EMA Multi-Timeframe Indicator is a powerful tool for traders seeking to capitalize on trends across multiple time horizons. By providing a comprehensive view of market dynamics and generating clear trading signals, this indicator can enhance decision-making and potentially improve trading outcomes. Remember to use this indicator as part of a broader trading strategy and always practice proper risk management.
Pineify: TradingView Pine Script Indicator & Strategy Generator
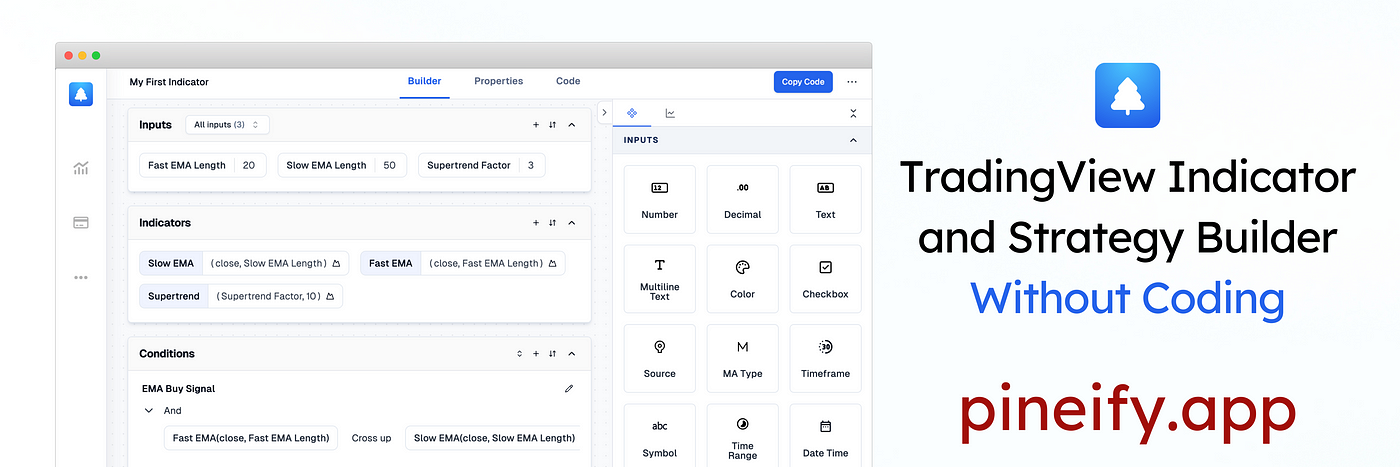
With Pineify, you can efficiently generate buy/sell indicators and custom strategies for TradingView Pine Script code creator. The best indicator and strategy backtest builder.
And you can easily create your own indicators and strategies without any coding skills, saving both time and money on freelancers.
TradingView Indicator & Strategy Generator: https://pineify.app/