Mastering Pine Script RSI for Trading Success
The Relative Strength Index (RSI) is a popular momentum oscillator used in technical analysis to measure the speed and change of price movements. This article will delve into the intricacies of coding the RSI in Pine Script, a domain-specific language for TradingView, and how to effectively utilize it for trading strategies.

Understanding RSI

What is RSI?
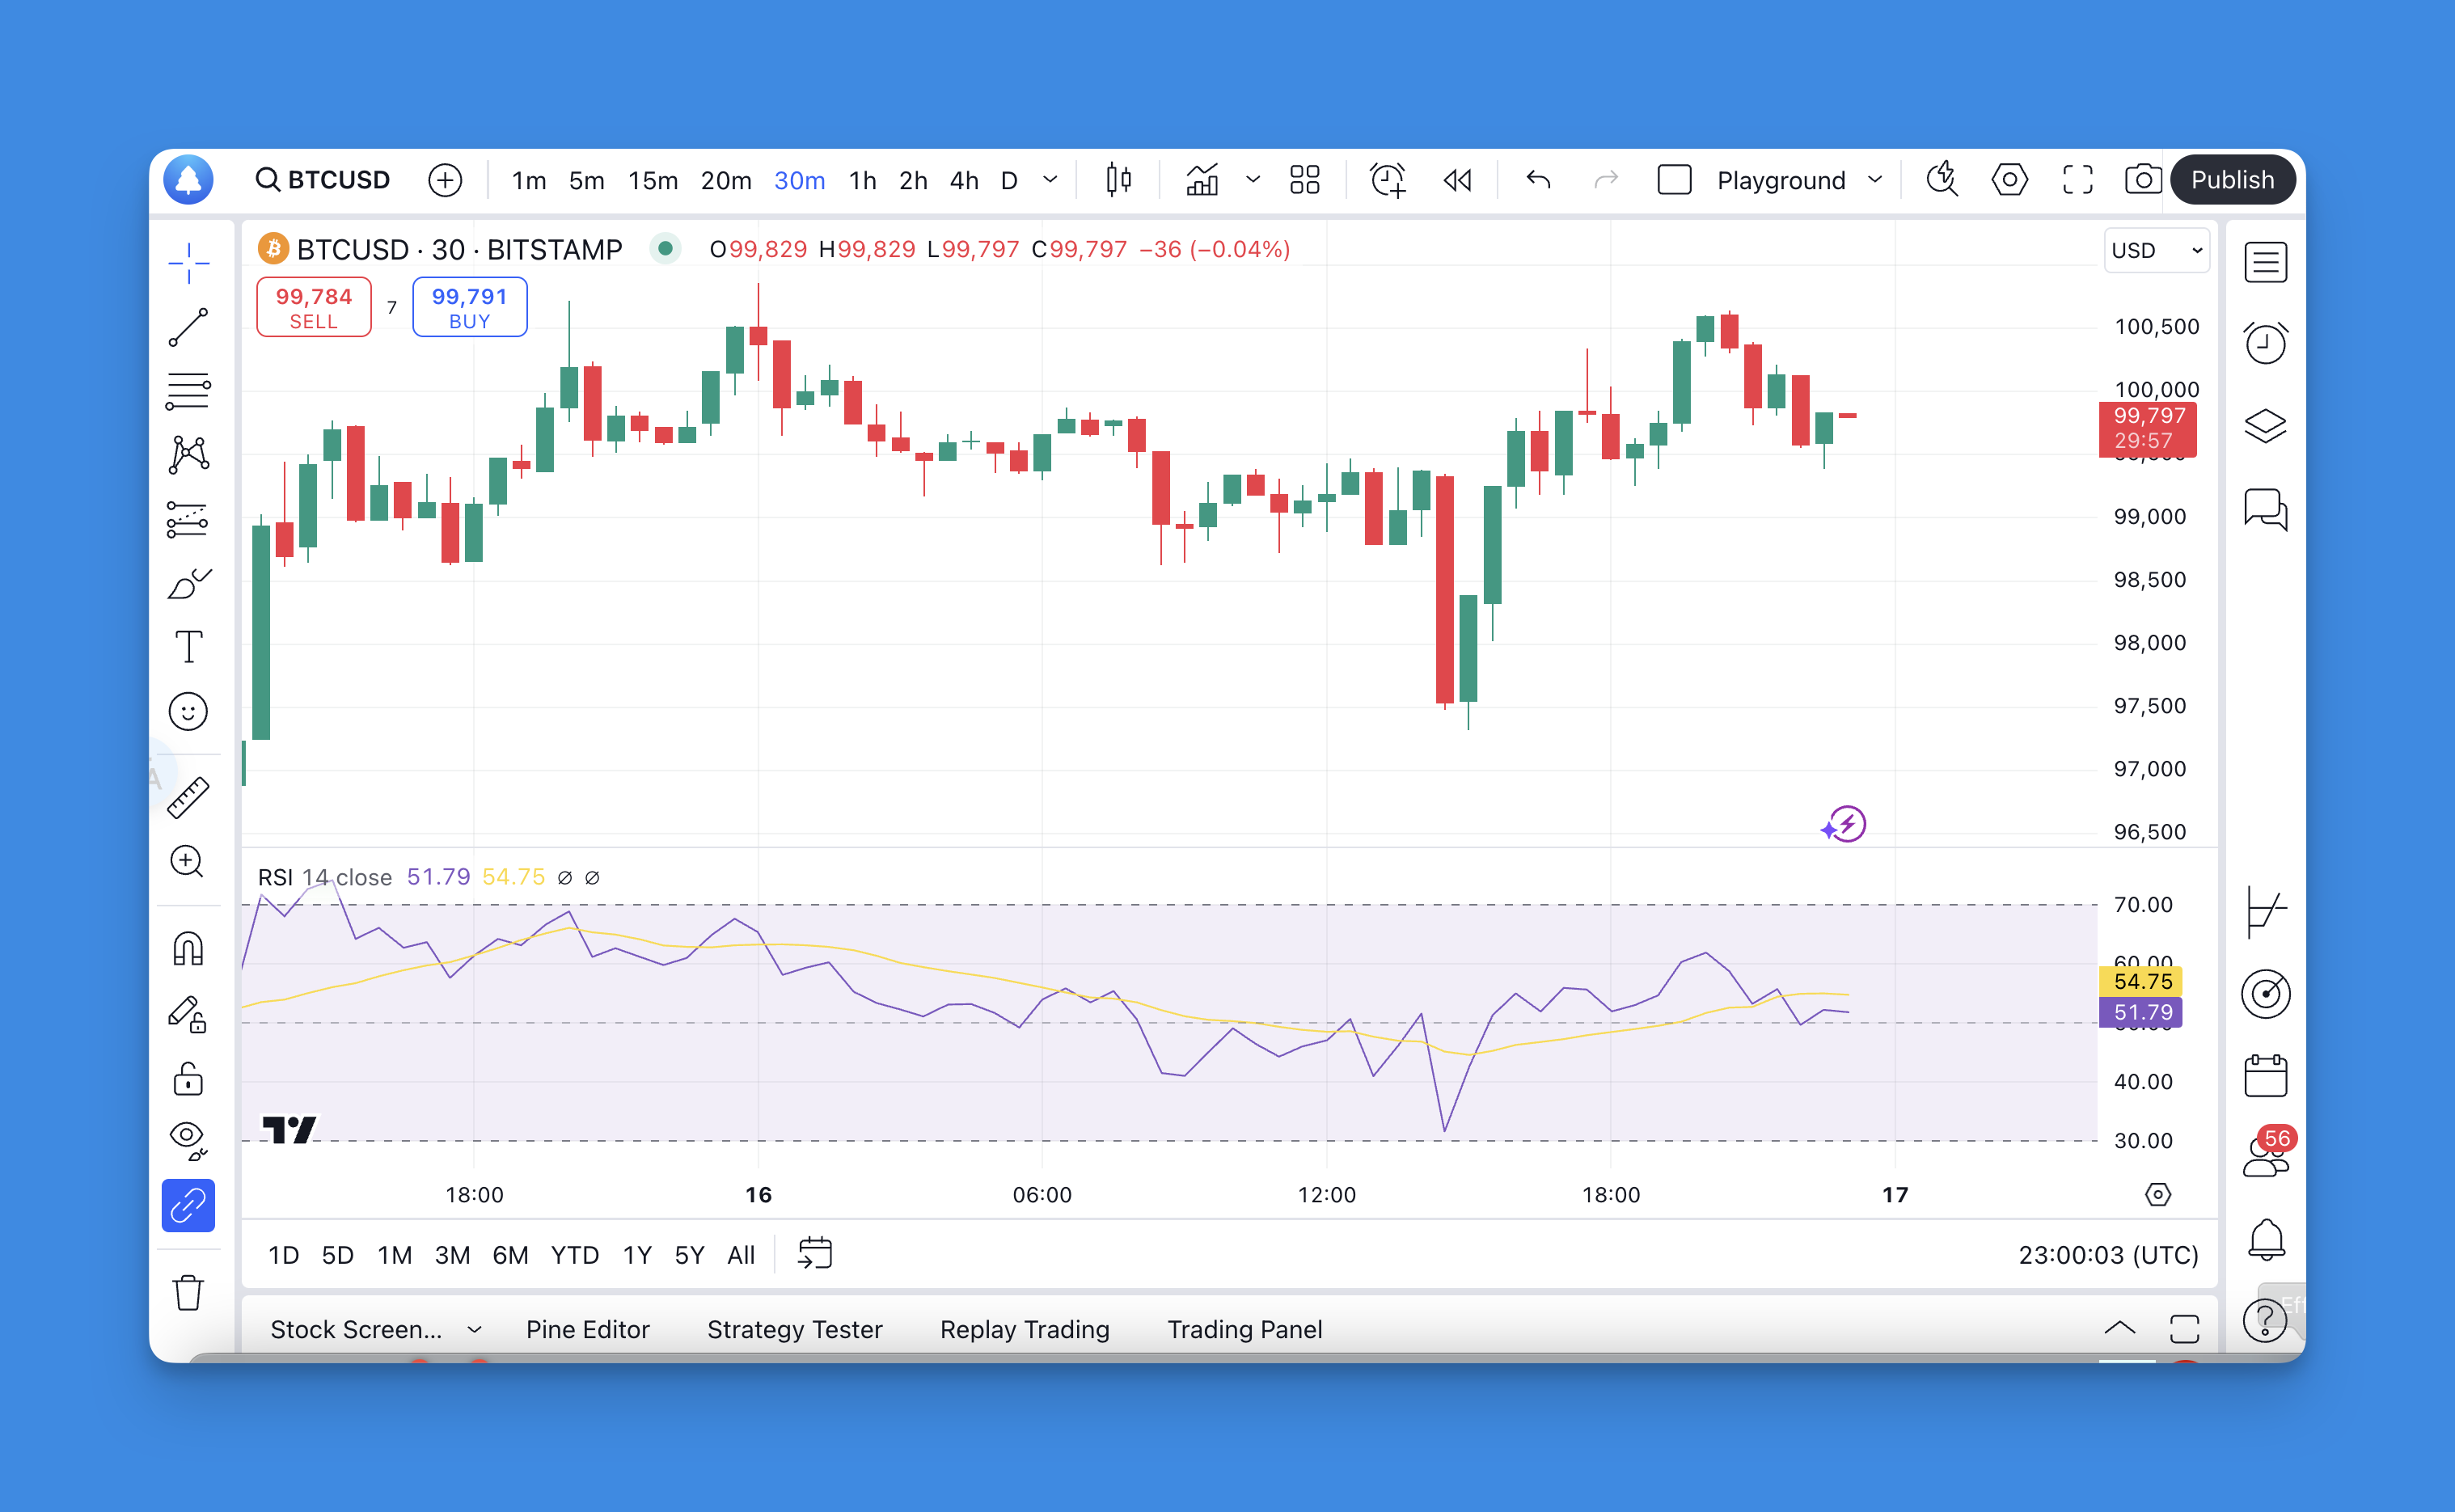
The RSI is a momentum indicator that oscillates between 0 and 100. Traditionally, an RSI above 70 indicates that a security is overbought, while an RSI below 30 suggests it is oversold. This information can be crucial for traders looking to identify potential reversal points in the market.
How is RSI Calculated?
The formula for calculating the RSI is as follows:

The average gain and average loss are typically calculated over a specified period, commonly set to 14 days.
Setting Up Pine Script for RSI
To create an RSI indicator in Pine Script, follow these steps:
Declare the Script
Begin by declaring the version of Pine Script you are using and naming your indicator.
//@version=6
indicator("[Pineify - Best Pine Script Generator] RSI Indicator", overlay=false)
Define User Inputs
Allow users to customize the parameters of the RSI, such as the length of the period for calculation.
rsi_length = input.int(14, title="RSI Length")
Calculate RSI
Use built-in functions to compute the average gains and losses, and then calculate the RSI.
ta.rsi(close, rsi_length)
Adding the RSI to TradingView Chart Without Coding

Website: Pineify
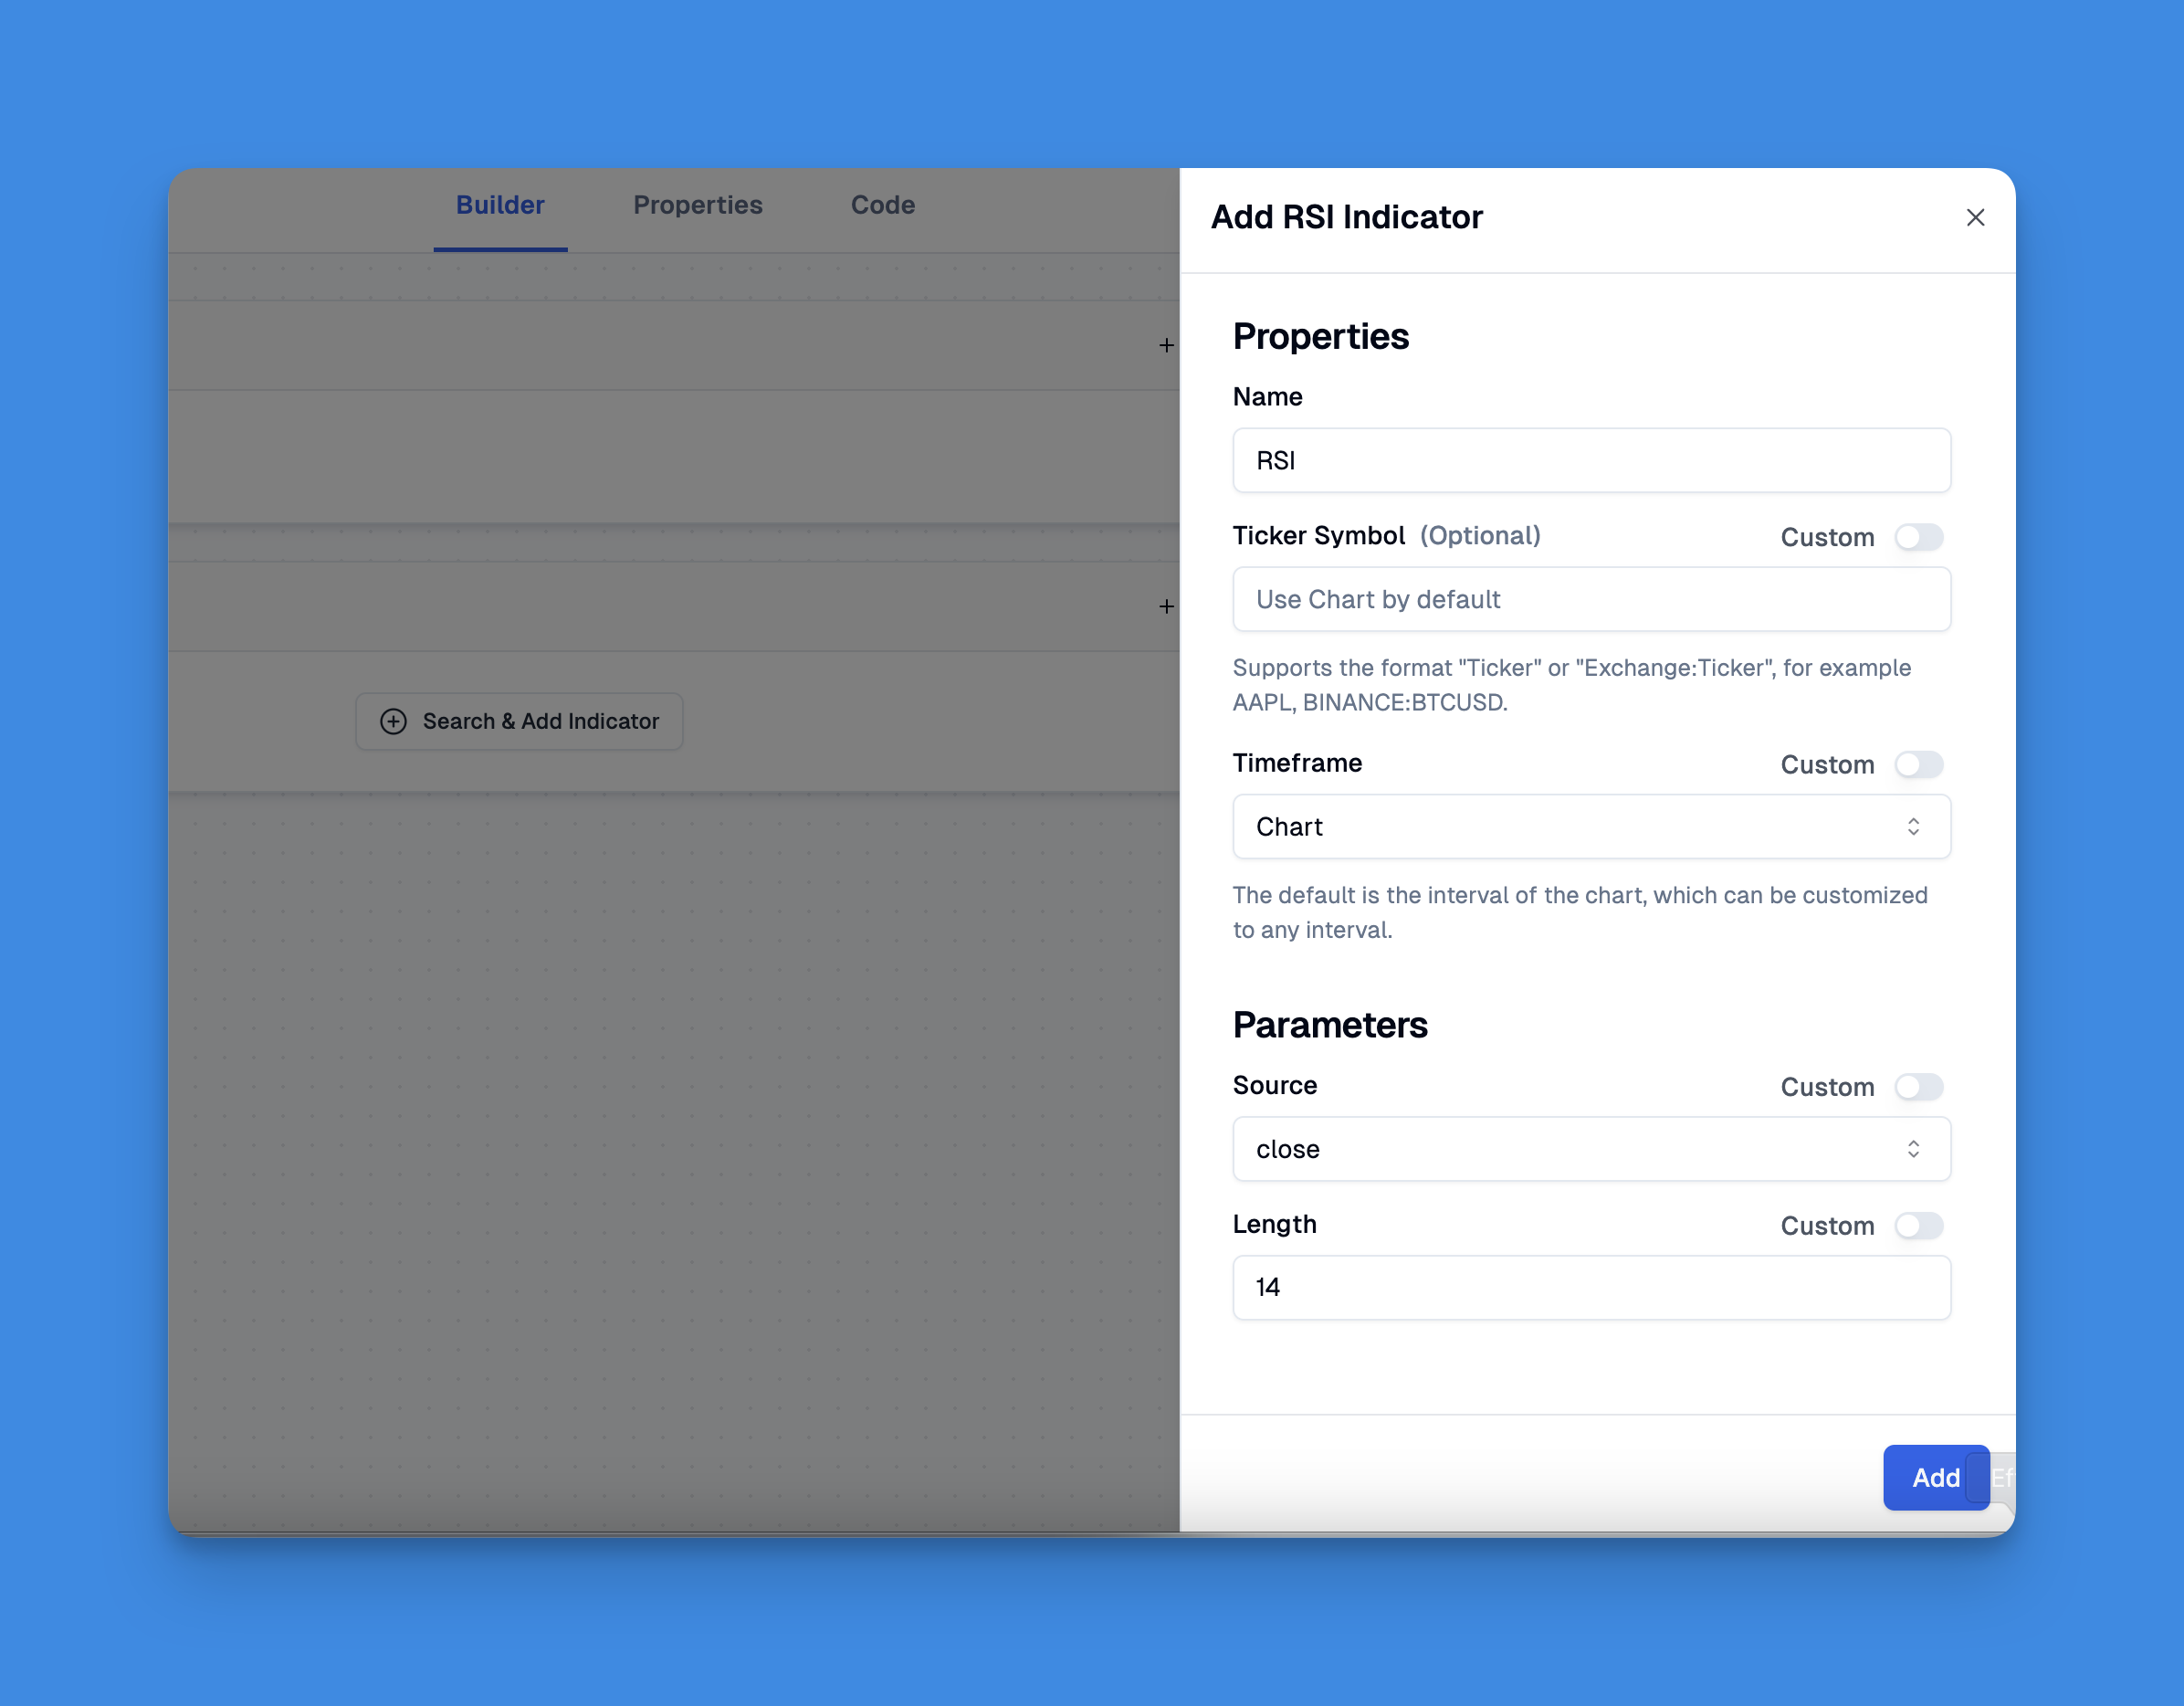
To add the RSI (Relative Strength Index) indicator to your TradingView chart without any coding, you can utilize the Pineify platform, which simplifies the process significantly.
Pineify is designed for traders who want to create and manage their indicators and strategies without needing programming skills. By leveraging its user-friendly interface, you can easily add the RSI indicator along with other technical indicators, bypassing TradingView's default limitation of only two indicators per chart.

Additionally, Pineify provides a powerful condition editor that enables you to combine various indicators and price data to formulate reliable trading rules. This means you can set specific parameters for the RSI, such as overbought and oversold levels, directly on your chart.
Click here to view all the features of Pineify.
Visualizing the RSI
After calculating the RSI, it's essential to visualize it on your chart for better analysis.
Plotting the RSI
To plot the calculated RSI values along with overbought and oversold levels:
plot(rsi, title="RSI", color=color.blue)
hline(70, "Overbought", color=color.red)
hline(30, "Oversold", color=color.green)
Enhancing Your RSI Indicator
You can enhance your basic RSI script by adding features like alerts or additional visual cues.
Adding Alerts
You can set alerts based on overbought or oversold conditions:
alertcondition(rsi > 70, title="Overbought Alert", message="RSI is overbought!")
alertcondition(rsi < 30, title="Oversold Alert", message="RSI is oversold!")
Practical Applications of RSI in Trading Strategies
The RSI can be integrated into various trading strategies. Here are some common applications:
- Trend Reversals: Traders often look for divergences between price movements and RSI readings to identify potential trend reversals.
- Entry and Exit Points: Use overbought/oversold levels to determine entry and exit points. For instance:
- Buy when the RSI crosses below 30 (oversold) and then back above.
- Sell when the RSI crosses above 70 (overbought) and then back below.
Conclusion
The Pine Script implementation of the Relative Strength Index provides traders with a powerful tool for analyzing market momentum. By understanding how to code the RSI and integrating it into trading strategies, traders can enhance their decision-making process.
References
- https://www.tradingview.com/support/solutions/43000502338-relative-strength-index-rsi/
- https://hackernoon.com/pinescript-for-beginners-writing-your-first-tradingview-indicator
- https://dev.to/theoryforcestudio/pine-script-recipes-for-rsi-based-indicators-1le1
- https://stackoverflow.com/questions/69030966/how-to-create-rsi-lookback-for-overbought-oversold-condition-pinescript
- https://www.youtube.com/watch?v=RDYkUsPaBPA
- https://www.techbobbles.com/single-post/algotrading-rsi-and-moving-average-strategy-using-pinescript-and-tradingview
- https://docs.algotest.in/signals/pinescripts/rsi_strategy/
