How to Plot Lines with Text in Pine Script: A Complete Guide
Are you looking to enhance your TradingView indicators by adding text to your plotted lines? This guide will walk you through the process of creating informative, visually appealing charts using Pine Script’s text and line plotting capabilities.

Understanding Pine Script’s Text and Line Functions
Pine Script offers several powerful functions for displaying text and lines on your charts. When it comes to adding text to lines, you have multiple options depending on your specific needs:
- plot() - The simplest way to create horizontal lines across your chart
- line.new() - For creating custom line segments with more control
- label.new() - For adding dynamic text labels to specific points on your chart
Each method has its advantages, and choosing the right one depends on what you’re trying to achieve with your indicator.
Creating Basic Horizontal Lines with Text

The simplest approach to plotting a horizontal line is using the plot() function:
plot(1, "My Horizontal Line", color=color.blue)
For more advanced horizontal lines with custom text labels, you can combine line.new() with label.new():
if barstate.islast
    line1 = line.new(bar_index, close, bar_index, close, extend=extend.both, style=line.style_solid, color=color.blue, width=2)
    label1 = label.new(bar_index + 5, close, str.tostring(close), xloc.bar_index, yloc.price, color.white, label.style_label_center)
This code creates a horizontal line at the closing price of the last bar and adds a label showing that price value.
Simplifying Line and Text Plotting Without Coding: The Pineify Advantage
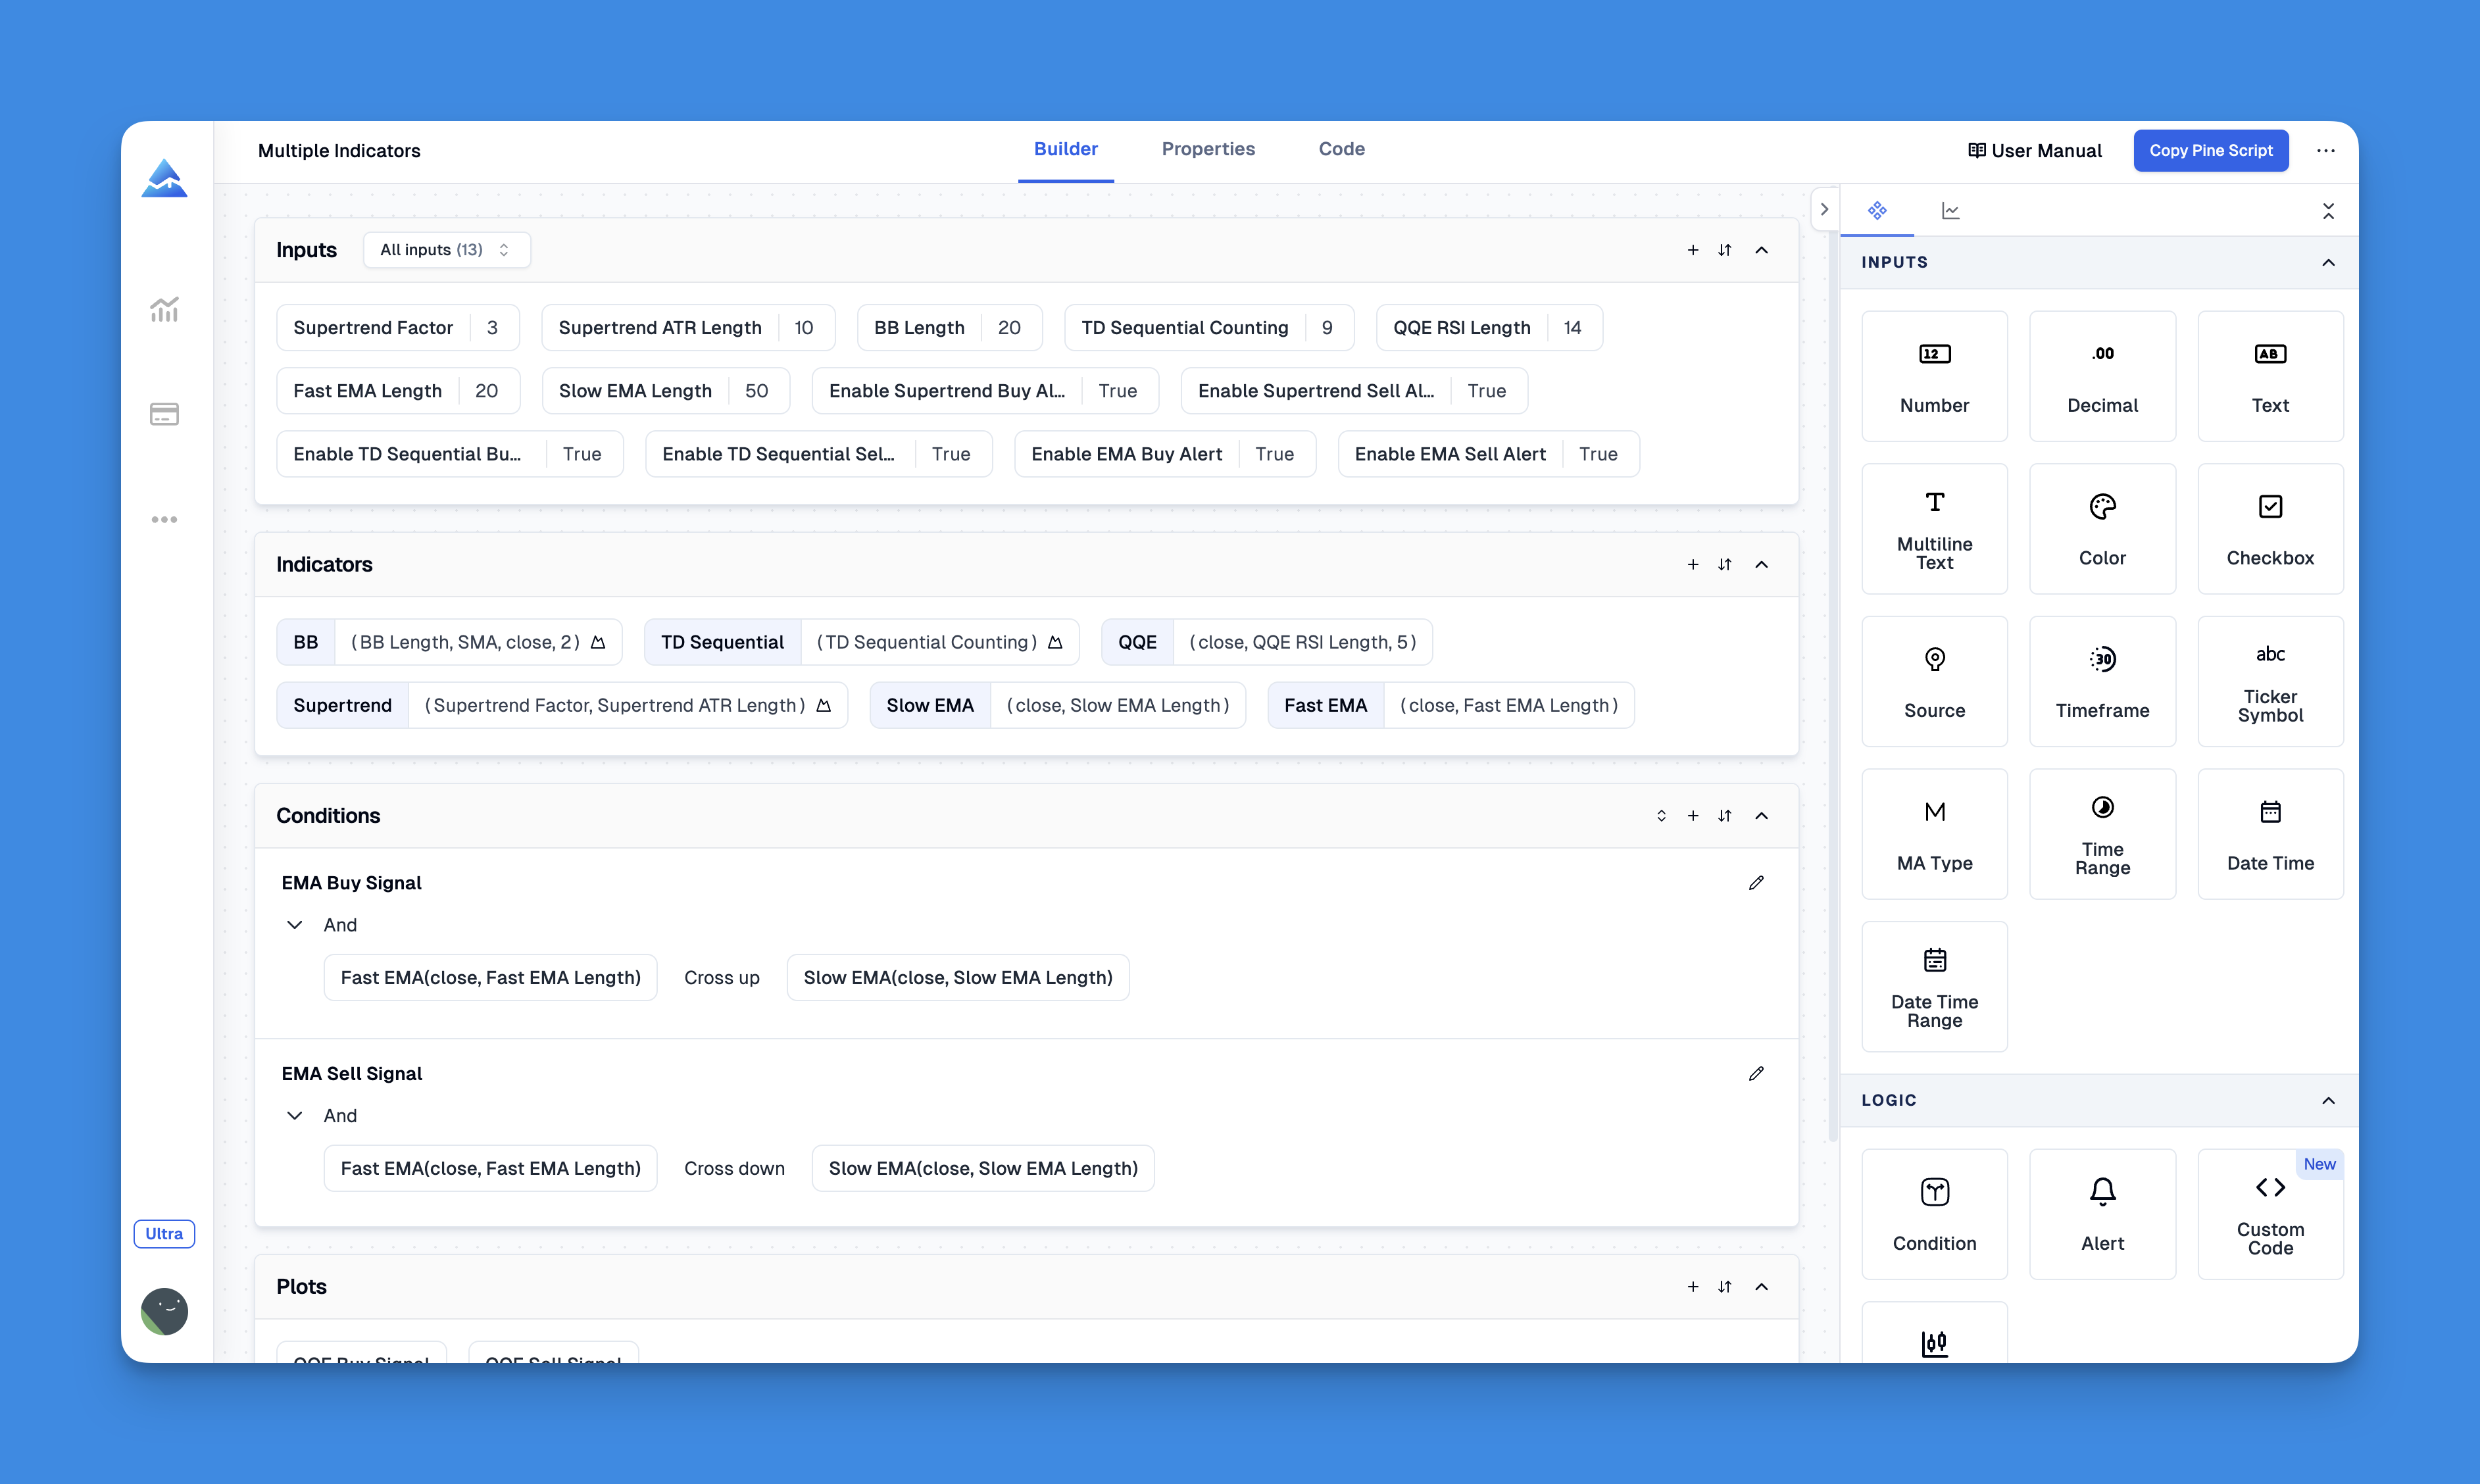
Creating detailed chart visualizations in Pine Script traditionally requires extensive coding knowledge, especially when combining line plotting with text labels. However, tools like Pineify have revolutionized this process by offering no-code solutions for traders looking to enhance their TradingView charts with sophisticated visuals.

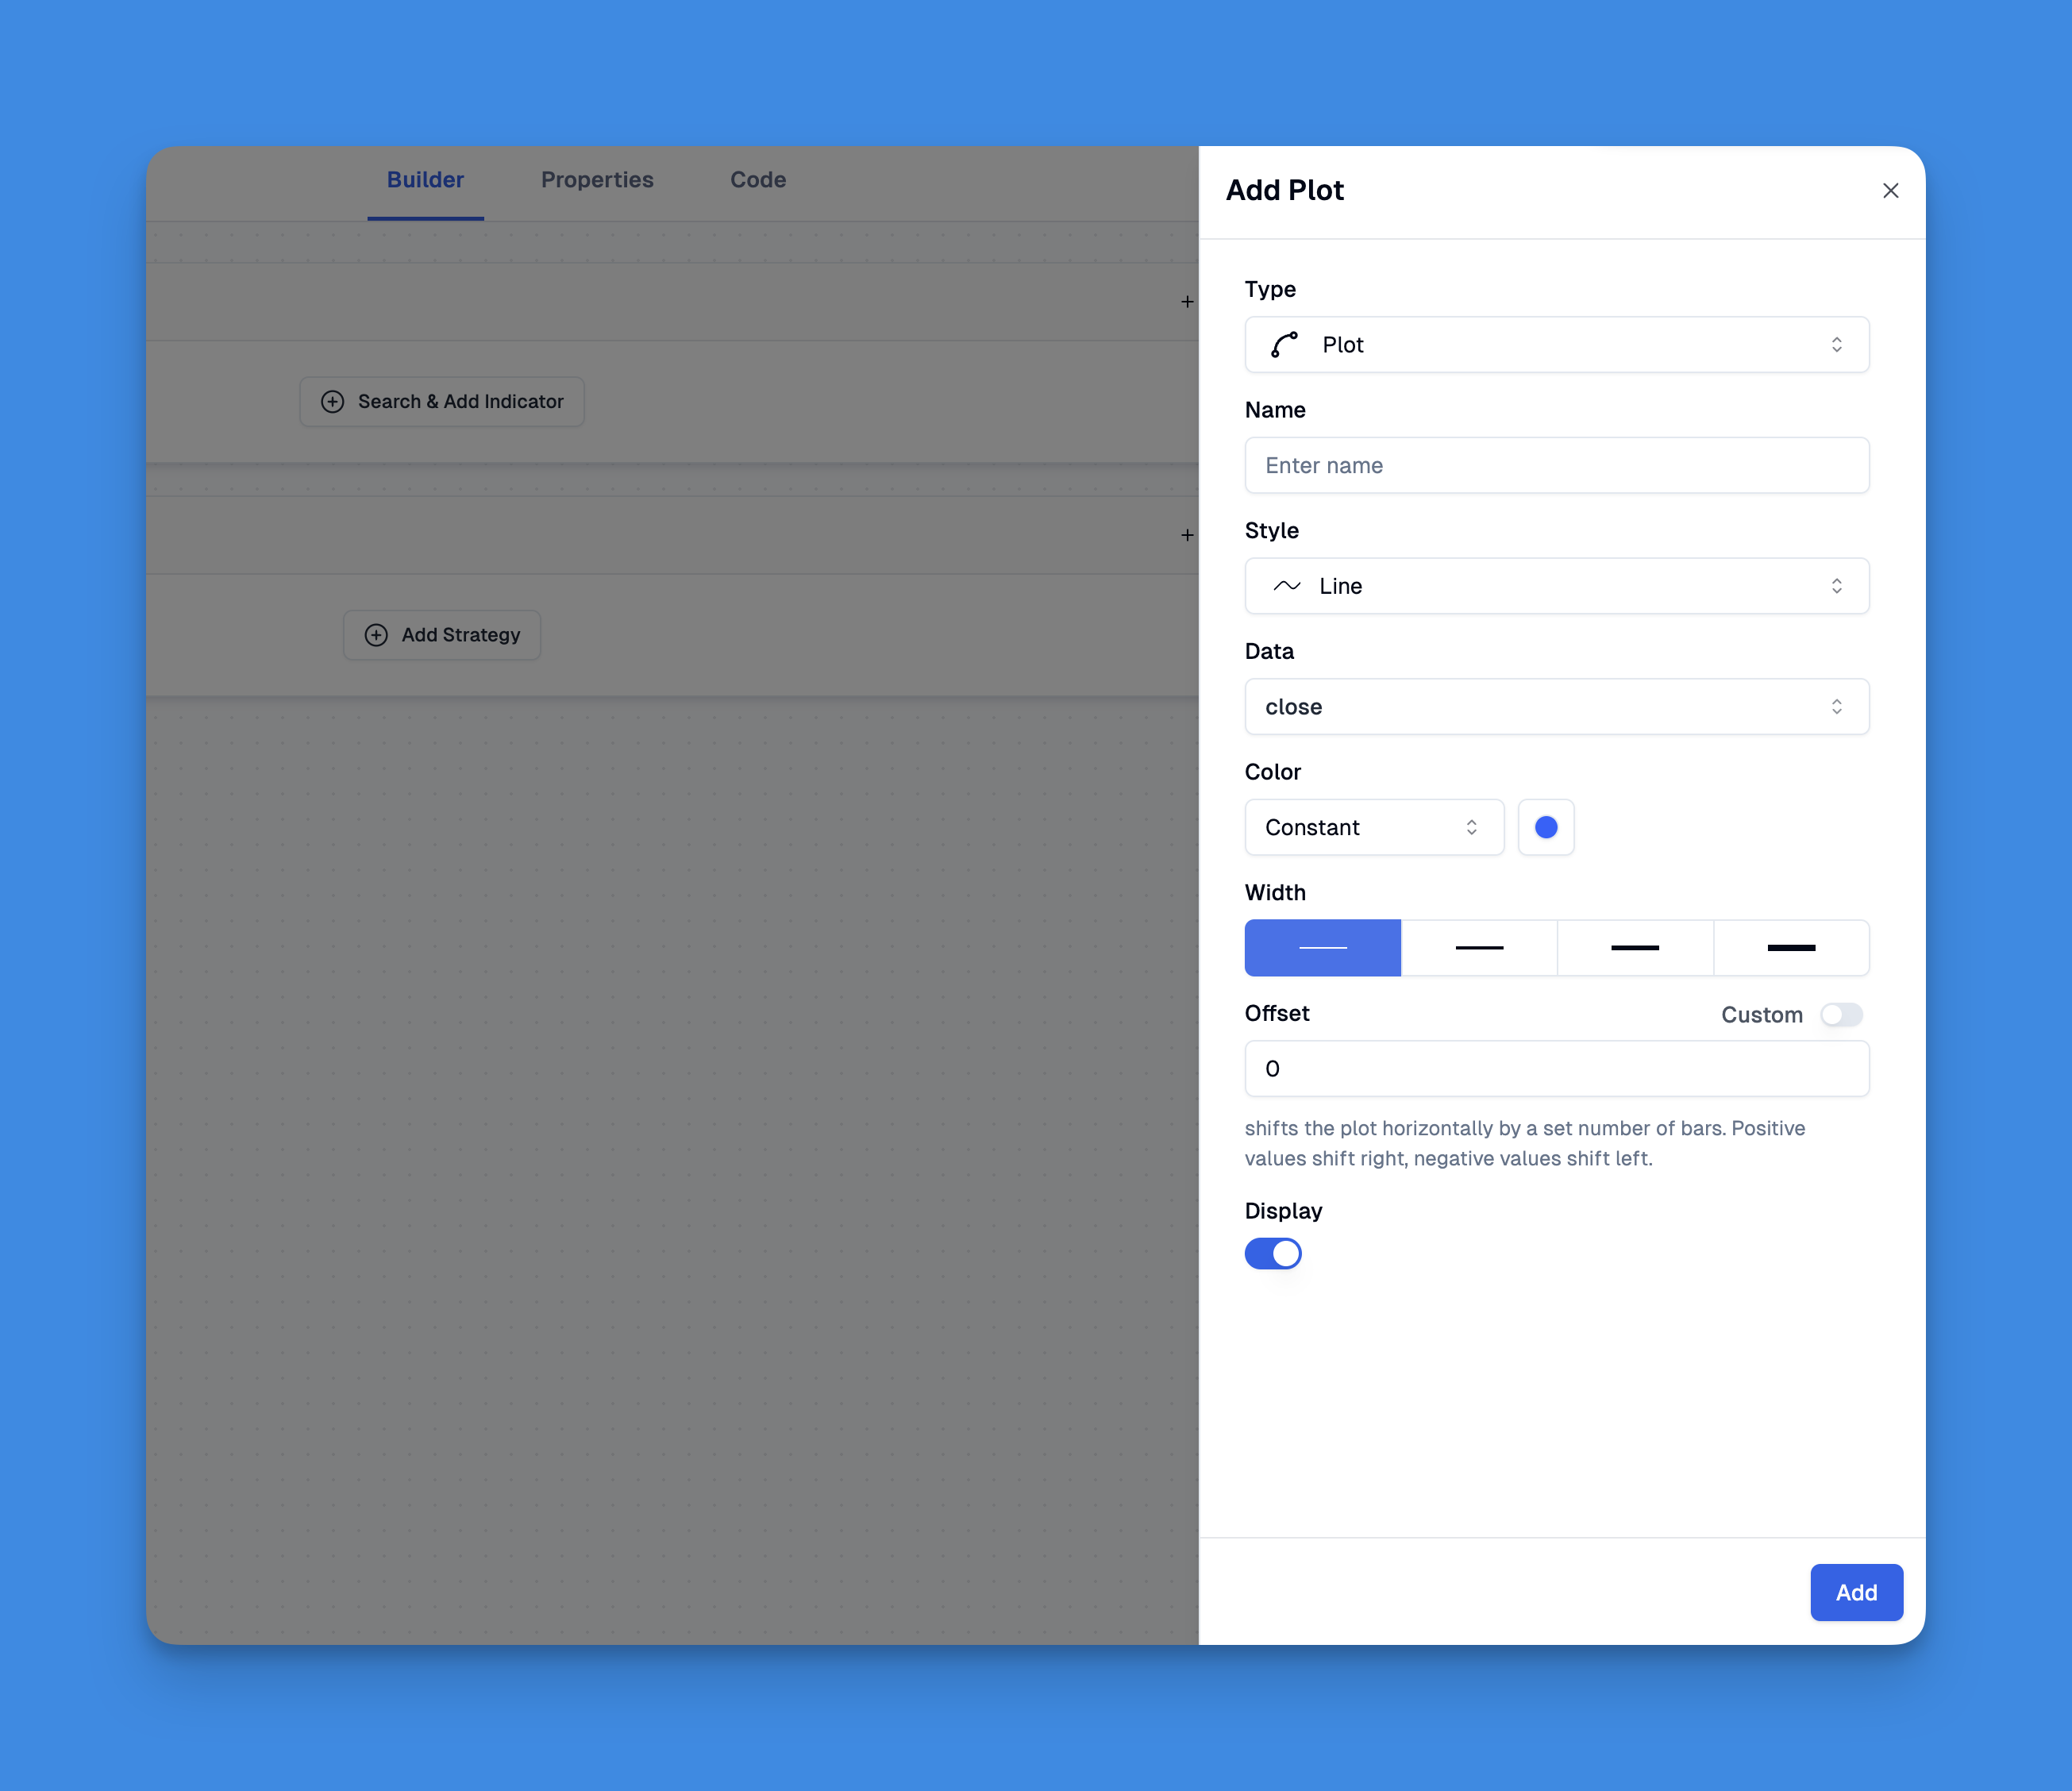
Pineify's user interface allows you to plot various elements on your charts without writing a single line of code. The platform supports multiple visualization methods including lines, histograms, background colors, candlestick charts, shapes, and characters. This versatility makes it ideal for traders who want to highlight key levels, trends, or signals with accompanying text explanations directly on their charts.

Website: Pineify
Click here to view all the features of Pineify.Optimizing Label Placement
When adding text to your lines, the label style matters significantly. Pine Script offers different label styles that affect text placement:
- label.style_label_up - Places text above the specified point
- label.style_label_center - Places text directly on the specified point
- label.style_label_down - Places text below the specified point
To position your text exactly on your line, use label.style_label_center:
label.new(bar_index, close, "Line Label", style=label.style_label_center)
Advanced Text and Line Techniques
For more sophisticated indicators, you might need to:
- Extract line positions: Use
line.get_x1(),line.get_y1(), etc. to get the coordinates of your lines - Update existing objects: Instead of creating new objects on every bar, use
line.set_*()andlabel.set_*()functions to update existing ones - Include dynamic values: Convert numeric values to strings using
str.tostring()before adding them to labels
// Example of updating a label with the current price
if barstate.islast
    price_text = str.tostring(close, "#.##")
    label.new(bar_index, close, price_text, style=label.style_label_center)
Conclusion
Adding text to plotted lines in Pine Script can significantly enhance the information value of your trading indicators. By combining line plotting functions with labels, you can create professional-looking indicators that provide clear, actionable information at a glance.
