What is Chande Momentum Oscillator (CMO) Indicator?
The Chande Momentum Oscillator (CMO) is a powerful technical indicator that helps traders analyze market momentum and identify potential trading opportunities. This versatile tool measures both upward and downward price movements, providing a comprehensive view of market dynamics. By oscillating between -100 and +100, it offers clear signals for overbought and oversold conditions, making it valuable for both short-term traders and long-term investors.
What is the Chande Momentum Oscillator Indicator?
The Chande Momentum Oscillator (CMO) is a technical analysis tool developed by Tushar Chande in the 1990s. This momentum indicator is designed to measure the strength of price movements in financial markets, providing traders with insights into potential price reversals and market conditions. Unlike traditional momentum indicators that focus solely on price gains, the CMO evaluates both upward and downward price movements, offering a more balanced perspective on market momentum.
The CMO operates within a range of -100 to +100, where readings above zero indicate upward momentum and readings below zero suggest downward momentum. The CMO is particularly useful for identifying overbought and oversold conditions, which can signal potential trading opportunities. A reading above +50 typically indicates an overbought condition, while a reading below -50 suggests an oversold condition.
How to Use CMO Indicator

Using the Chande Momentum Oscillator effectively involves understanding its readings and how they relate to market conditions. Here are some key strategies for utilizing the CMO:
- Identify Overbought and Oversold Levels: Traders often use the CMO to determine when an asset may be overbought or oversold. When the CMO approaches +100, it indicates that the asset may be overbought, suggesting a potential price reversal or correction. Conversely, when it nears -100, it signals oversold conditions, indicating a possible upward price movement.
- Monitor Zero Line Crossovers: The zero line serves as a critical reference point for interpreting CMO signals. A crossover above zero suggests bullish momentum, while a crossover below zero indicates bearish momentum. Traders often look for these crossovers in conjunction with other indicators to confirm their trading decisions.
- Divergence Analysis: Divergences between the CMO and price action can provide valuable insights into potential trend reversals. For instance, if prices are making higher highs while the CMO is making lower highs, this bearish divergence may signal an impending price decline. Conversely, if prices are making lower lows while the CMO is making higher lows, this bullish divergence could indicate a potential price increase.
- Combine with Other Indicators: To enhance trading accuracy, traders often combine the CMO with other technical indicators such as moving averages or trend lines. This multi-faceted approach helps confirm signals generated by the CMO and reduces the likelihood of false signals.
What is TradingView and Pineify?
TradingView is a popular platform for traders and investors that provides advanced charting tools, social networking features, and access to a wide range of financial instruments. It allows users to analyze market trends, share insights, and develop trading strategies using various technical indicators. One of the standout features of TradingView is its support for custom scripting through Pine Script, which enables users to create personalized indicators and strategies.
Pineify is an innovative tool designed specifically for TradingView users who want to create and manage their trading indicators and strategies without needing any coding skills. With Pineify, traders can easily generate complex Pine Script code using visual tools, allowing them to build customized indicators quickly.

Website: Pineify
Click here to view all the features of Pineify.Adding the CMO Indicator to TradingView Chart Without Coding
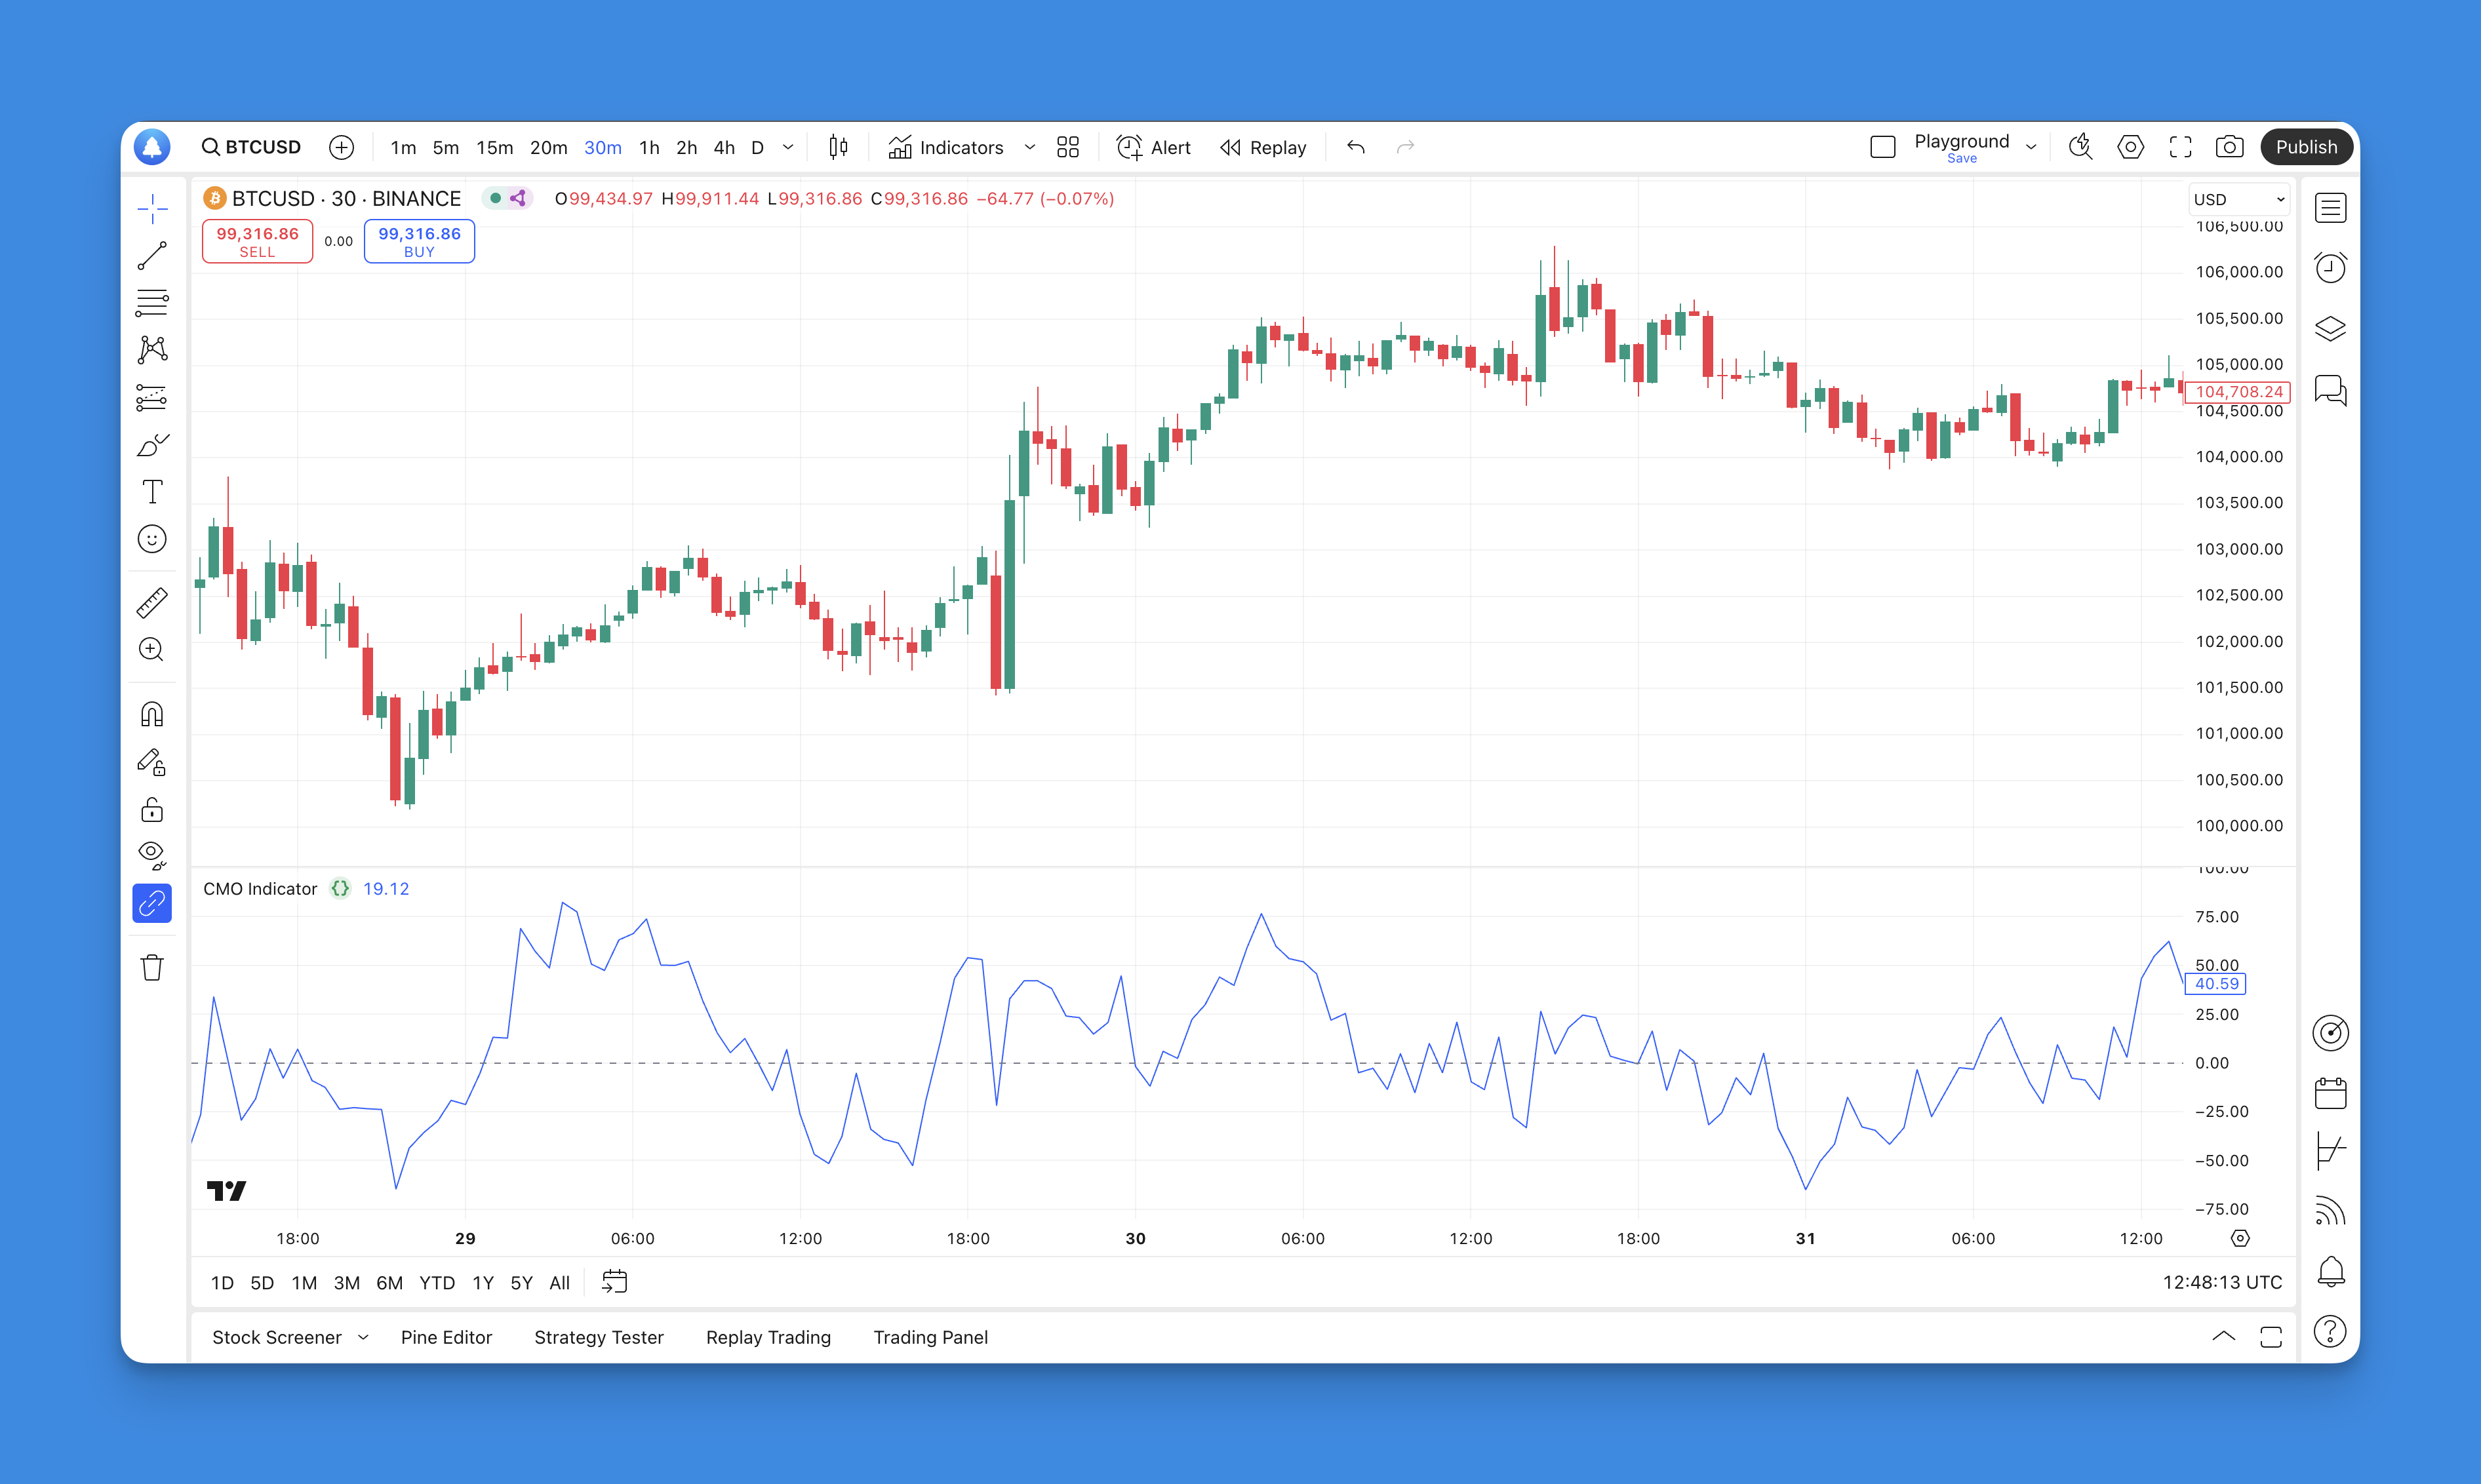
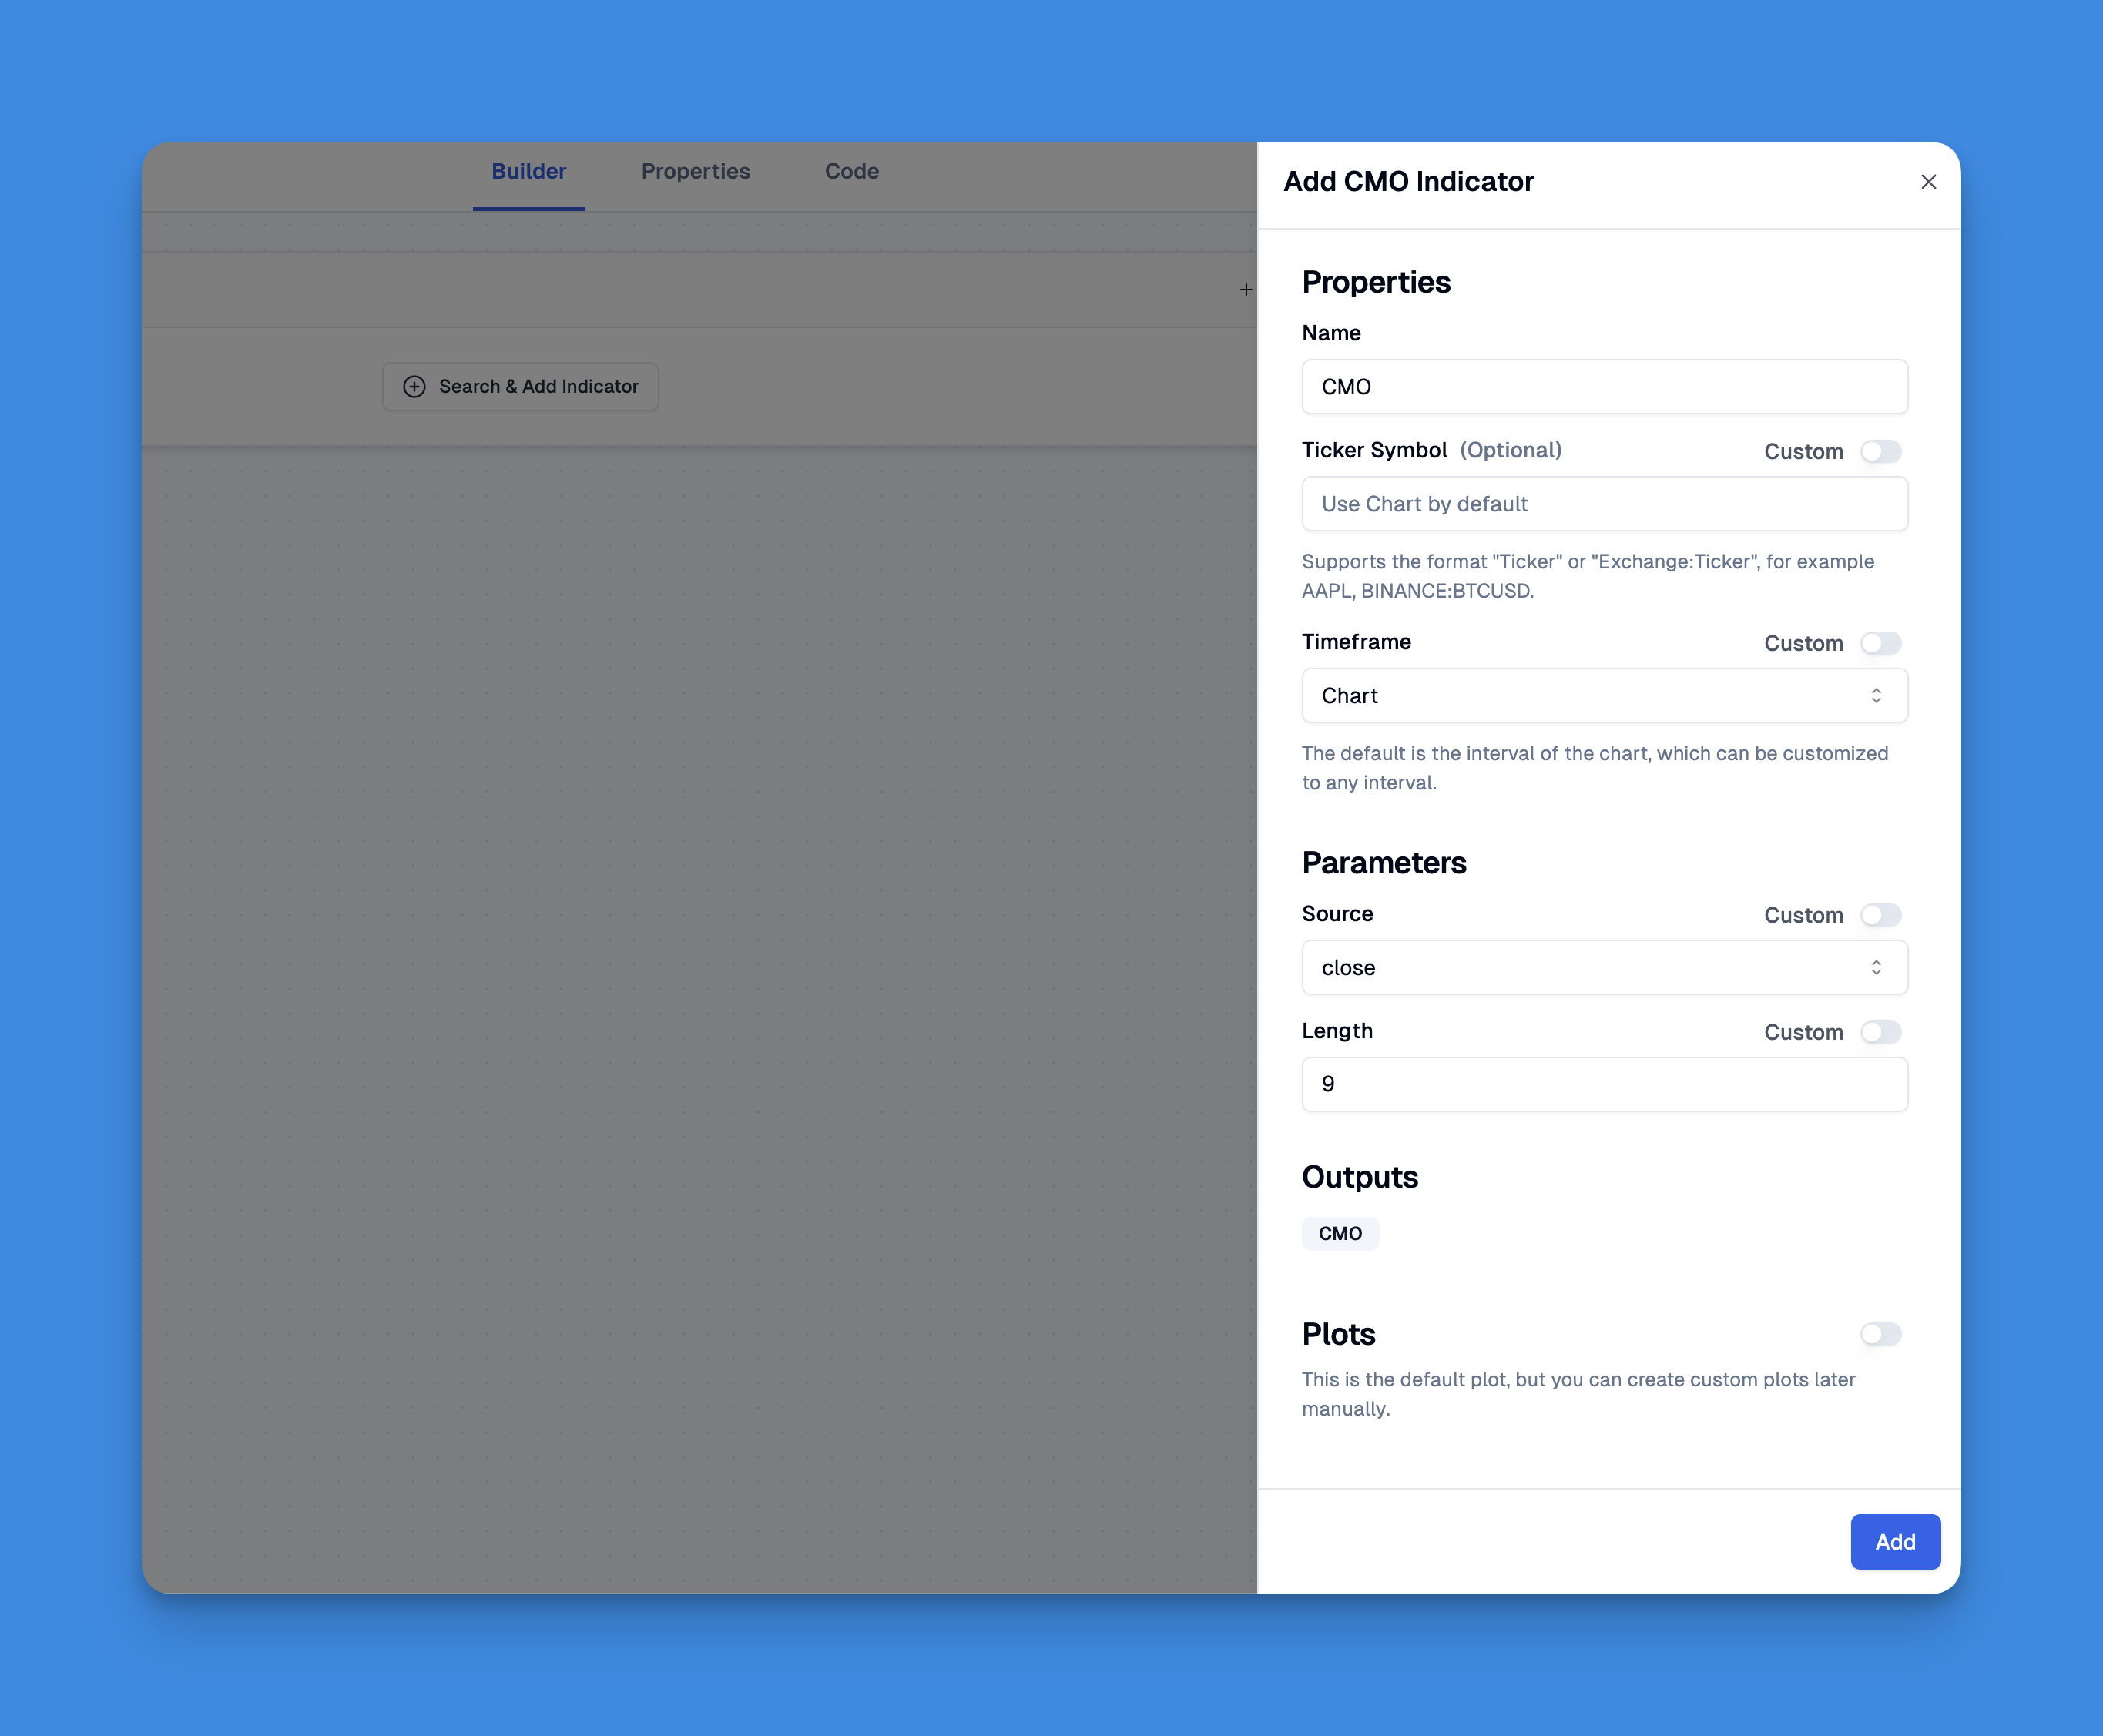
Incorporating the Chande Momentum Oscillator (CMO) into your TradingView charts has never been easier, thanks to Pineify. Users can leverage Pineify’s intuitive interface to add the CMO indicator without writing a single line of code.
The platform allows you to import existing scripts or create new ones using its powerful condition editor. This feature enables you to combine various technical indicators and price data seamlessly.
Advantages of the CMO
The Chande Momentum Oscillator offers several advantages that make it a popular choice among traders:
- Balanced Measurement: By considering both upward and downward movements in its calculations, the CMO provides a more comprehensive view of market momentum compared to traditional indicators.
- Clear Overbought and Oversold Signals: The defined thresholds for overbought (+50) and oversold (-50) conditions allow traders to make informed decisions about potential entry and exit points.
- Versatile Application: The CMO can be applied across various time frames, making it suitable for day traders as well as long-term investors. Its adaptability enhances its utility in different trading strategies.
- Visual Clarity: The oscillator's single-line format makes it easy to interpret at a glance, allowing traders to quickly assess market conditions without getting bogged down in complex calculations.
CMO in Trading Strategies
Incorporating the Chande Momentum Oscillator into trading strategies can enhance decision-making processes. Here are some common strategies that utilize the CMO:
- Trend Following: Traders can use the CMO to confirm existing trends. For example, if an asset is trending upwards and the CMO remains above zero, it reinforces the bullish trend. Traders might enter long positions during these periods.
- Counter-Trend Trading: When extreme overbought or oversold levels are reached (e.g., +70 or -70), some traders may opt for counter-trend trades. This strategy involves taking short positions when overbought or long positions when oversold, anticipating corrections.
- Breakout Confirmation: The CMO can also serve as a confirmation tool for breakouts. If an asset breaks through resistance while the CMO crosses above zero, it may indicate strong bullish momentum supporting the breakout.
Limitations of the CMO
While the Chande Momentum Oscillator has many benefits, it also has limitations that traders should consider:
- Lagging Indicator: As a lagging indicator, the CMO relies on historical price data. This means it may provide signals after significant price movements have already occurred, potentially leading to missed opportunities.
- False Signals in Sideways Markets: In choppy or sideways markets where prices fluctuate without clear trends, the CMO may generate false signals that can mislead traders into making poor decisions.
- Sensitivity to Market Conditions: The effectiveness of the CMO can vary depending on market volatility and trends. In highly volatile markets, it may produce erratic readings that complicate interpretation.
To mitigate these limitations, traders are encouraged to use the CMO alongside other technical indicators or analysis techniques to confirm signals and enhance overall trading accuracy.
Conclusion
The Chande Momentum Oscillator is a powerful tool for traders seeking to analyze market momentum effectively. Its ability to measure both upward and downward movements provides a balanced perspective that can enhance trading strategies across various time frames. While it offers clear advantages such as identifying overbought and oversold conditions and confirming trends, traders must also be aware of its limitations as a lagging indicator susceptible to false signals in volatile markets.