Unlocking the Power of Pine Script Study Annotations
Pine Script, a powerful tool for traders and analysts on TradingView, allows users to create custom indicators and strategies with ease. At the heart of every Pine Script indicator lies the study annotation, which defines the properties of an indicator. In this article, we’ll delve into the world of Pine Script study annotations, exploring their importance, functionality, and how they can enhance your trading experience.
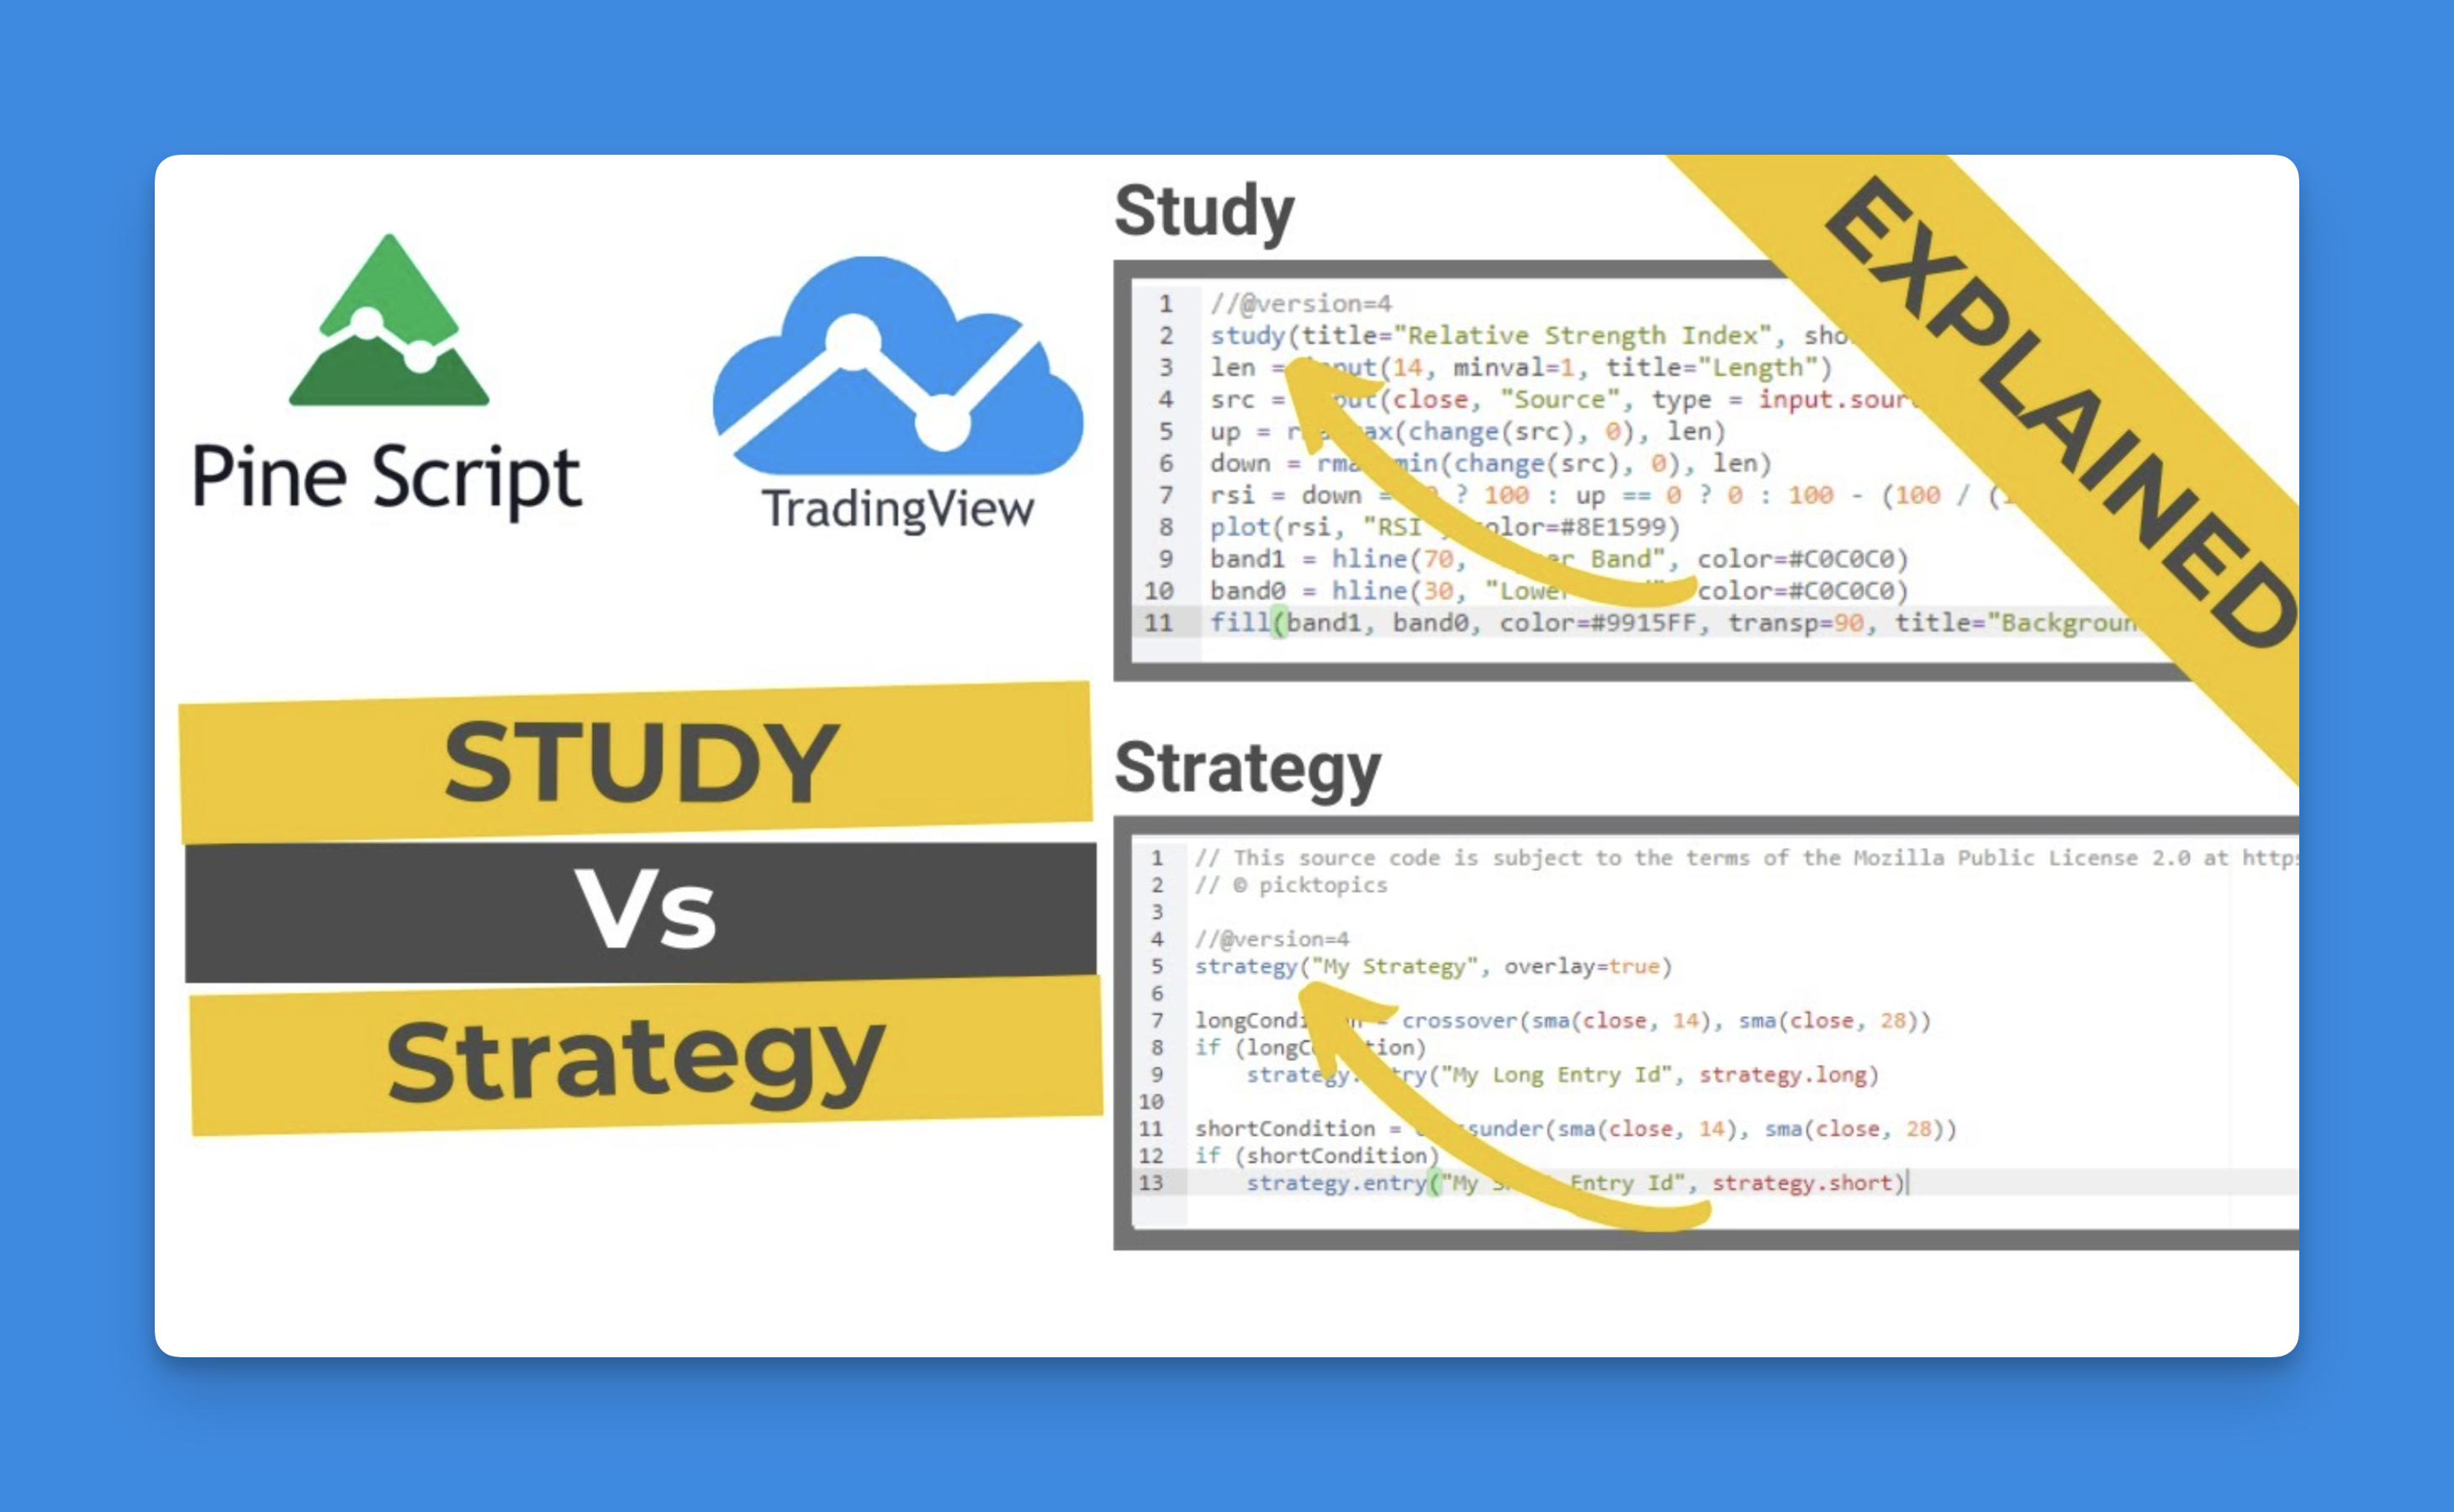
What is a Study Annotation in Pine Script?
A study annotation in Pine Script is a crucial function that sets the general properties of an indicator. It is mandatory to include at least one study() call in every indicator script. The study() function requires a title parameter, which specifies the name of the indicator visible in the Indicators dialog box on TradingView. This title is independent of the script’s file name in your Personal Library.
Key Parameters of Study Annotations
title: The full name of the indicator.shorttitle: A shorter version of the title, displayed in the chart’s legend. If not specified, it defaults to thetitle.overlay: A boolean value indicating whether the study should be displayed as an overlay on the main chart (true) or in a separate pane (false, default).format: Specifies the formatting for study values, with options likeformat.inherit,format.price, andformat.volume.precision: The number of decimal places for study values, overriding the default formatting if specified.

Benefits of Customizing Study Annotations
Customizing study annotations allows traders to tailor indicators to their specific needs:
- Enhanced Readability: By adjusting the
shorttitle, you can ensure that your indicators are easily identifiable on crowded charts. - Flexibility: The
overlayparameter lets you choose how your indicators are displayed, either integrated with the price chart or in a separate pane. - Precision Control: Adjusting the
precisionhelps in presenting data in a clear and concise manner, which is crucial for making informed trading decisions.
How to Use Study Annotations Effectively
To maximize the potential of study annotations:
- Use Clear Titles: Ensure that your
titleandshorttitleare descriptive and concise. - Optimize Display: Choose whether to overlay your indicator on the main chart or display it separately based on your trading strategy.
- Format Data: Select the appropriate format and precision to ensure that your data is presented clearly and accurately.
Conclusion
Pine Script study annotations are a powerful tool for creating and customizing indicators on TradingView. By understanding and leveraging these annotations, traders can enhance their analysis and decision-making processes. Whether you’re a seasoned trader or just starting out, mastering study annotations can elevate your trading experience.