Best QQE Indicator Strategies for Beginner
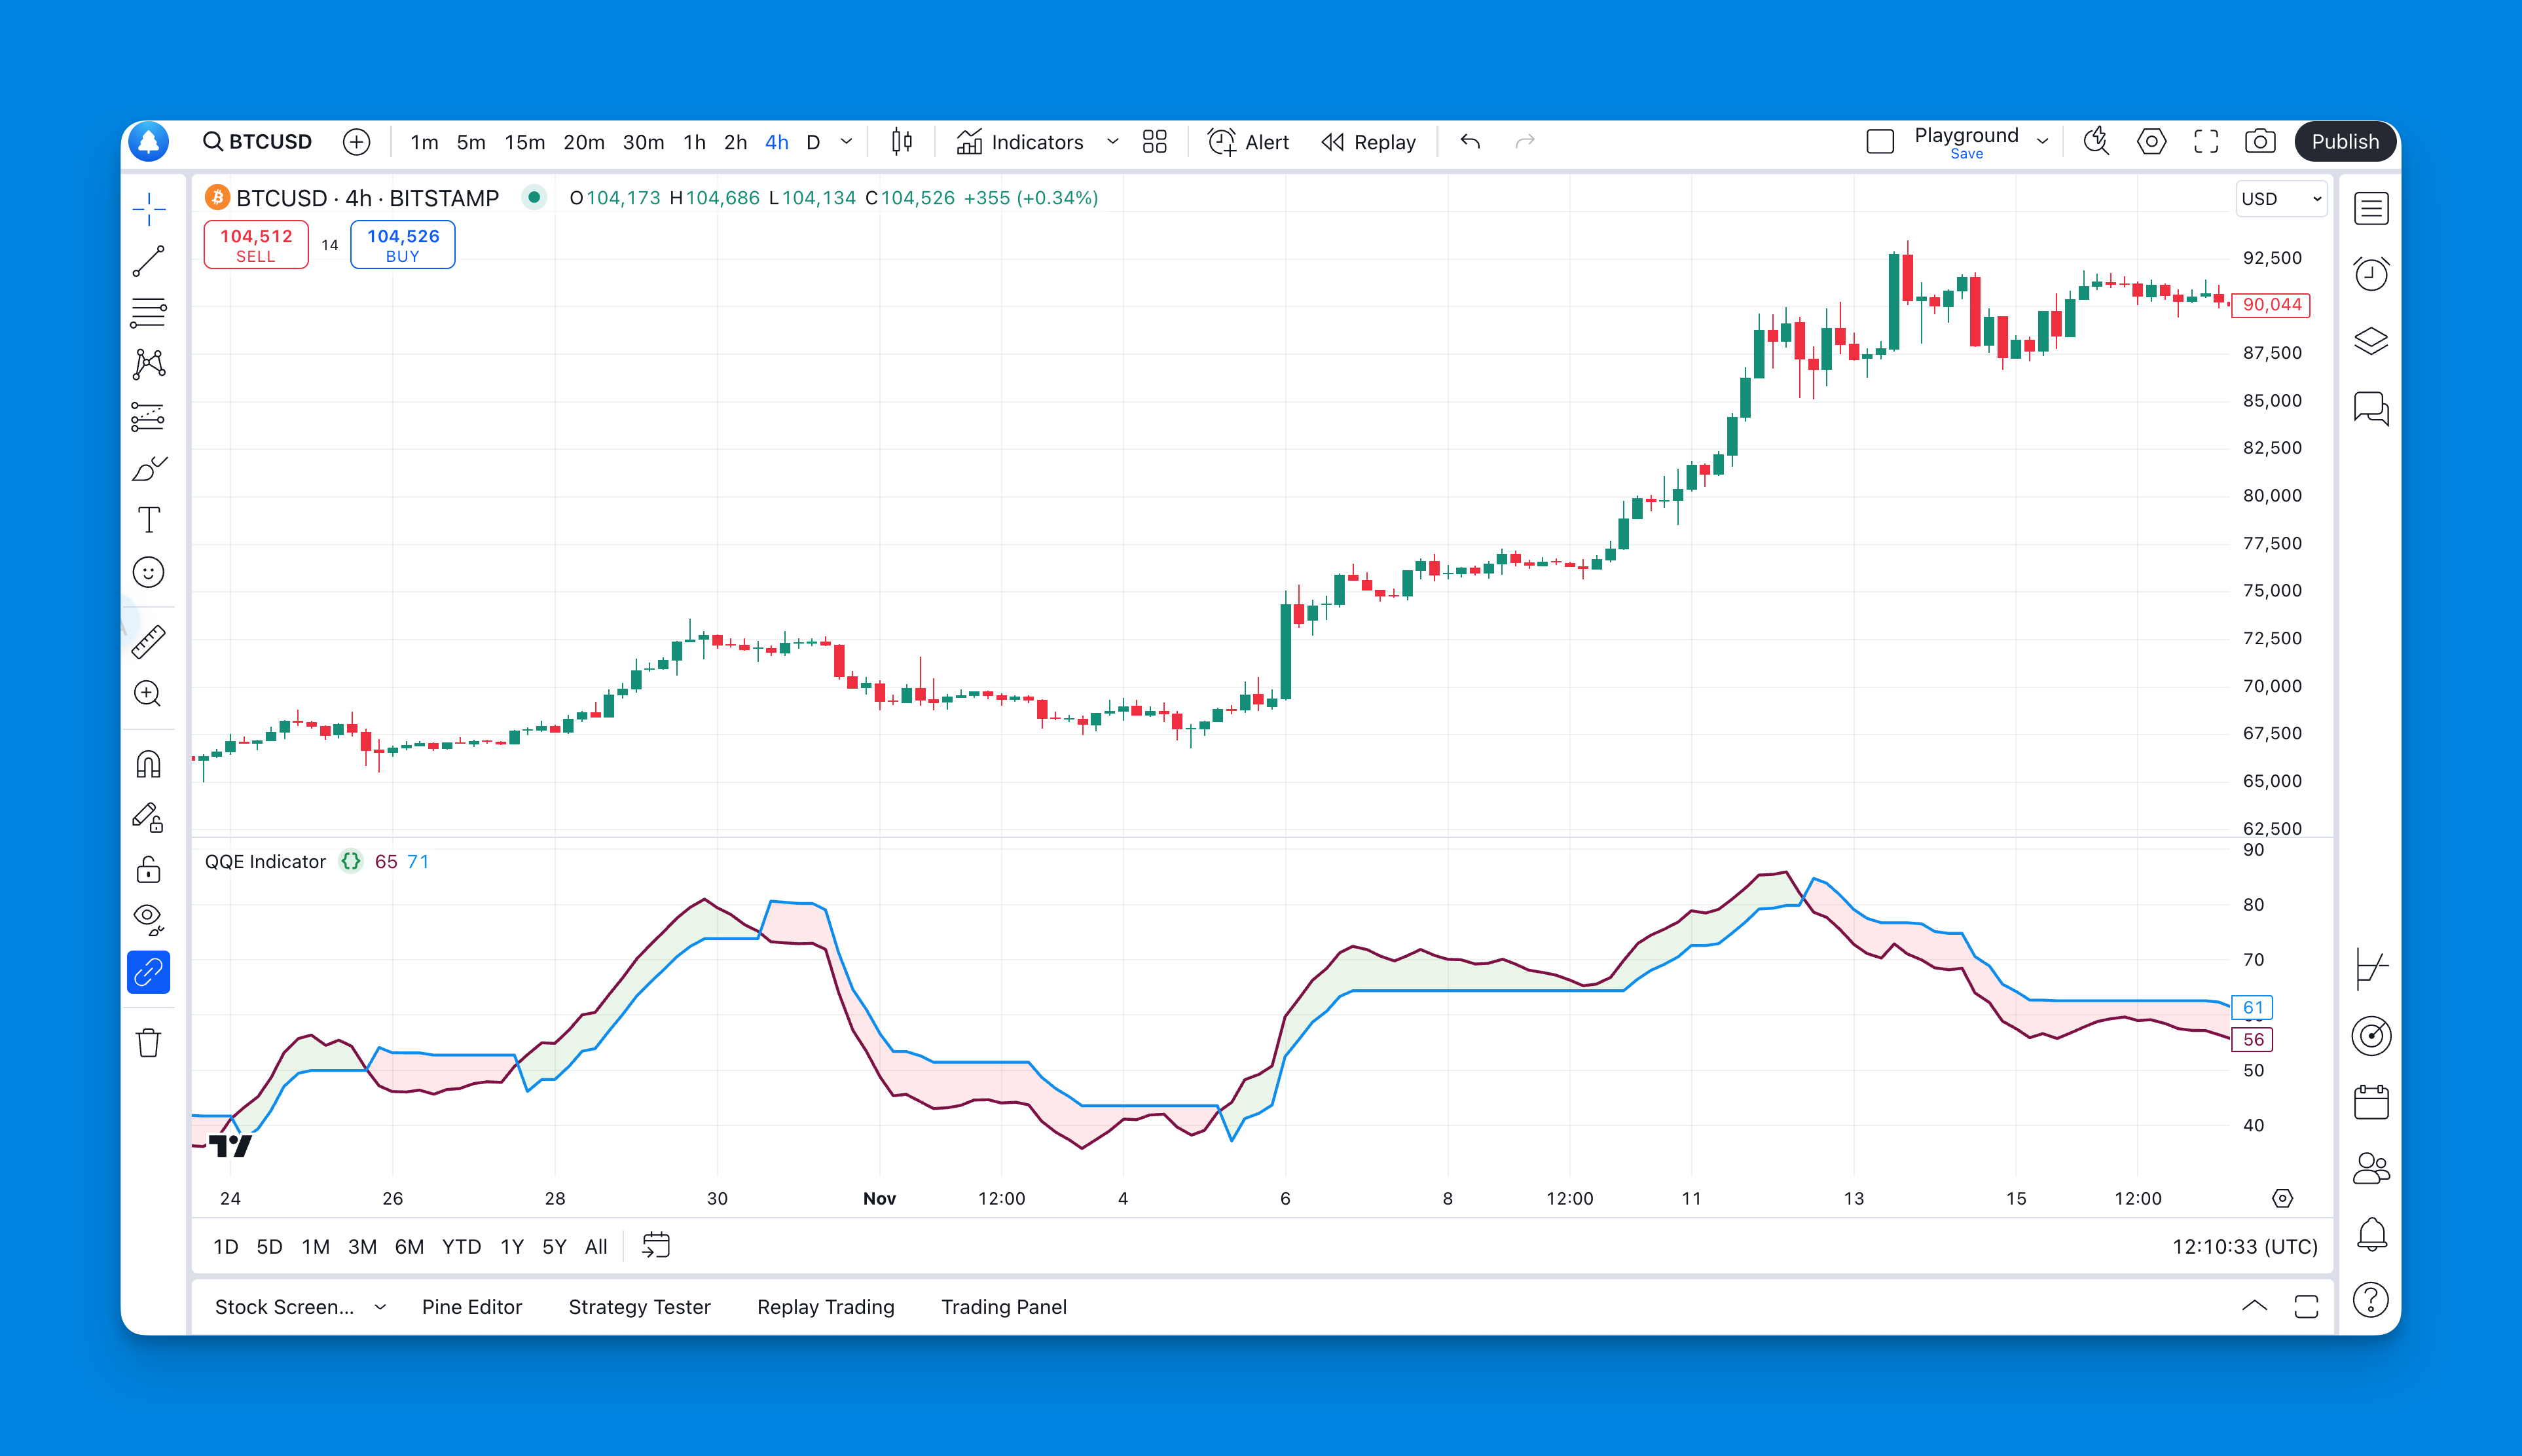
The QQE indicator is a momentum oscillator that smooths out RSI's rough edges to give you cleaner signals. I started testing it on SPY after getting burned by a false RSI reading in March 2025, and it surprised me how much the noise dropped. Before QQE, I'd watch RSI flip-flop between overbought and oversold while price just kept grinding sideways — that's where it fell apart for me.
You can find QQE pre-built on TradingView or build your own if you're comfortable with Pine Script. If you're not, tools like Pineify let you generate it without writing code.
What Exactly Is the QQE Indicator?

QQE stands for Quantitative Qualitative Estimation. Despite the academic-sounding name, the concept is simple: it takes RSI and runs it through a smoothing filter to reduce false signals. The result is a dual-line oscillator on a 0-100 scale that's much harder to fake out than plain RSI.
Think of QQE as RSI with a quality noise filter. Traditional RSI can give you whipsaw signals that'll drive you crazy in choppy markets. QQE takes that same momentum concept and preserves the moves that actually have steam behind them while filtering out the random price jitter.
The Core Components That Matter
Here's what makes QQE different from other momentum oscillators:
- Dual-line system: You get a main QQE line and a slower signal line. When these two cross, that's where the actionable signals appear
- RSI foundation: It builds on RSI but applies additional smoothing to reduce false signals
- 0-100 scale: Just like RSI, it oscillates between 0 and 100, so the learning curve is shallow
- Trend identification: Unlike basic RSI, QQE does a better job showing you the overall market direction rather than every minor wiggle
Reading the Signals
The beauty of QQE lies in its simplicity:
- Above 50: Bulls are generally in control
- Below 50: Bears are running the show
- Above 70: Potentially overbought territory (but don't automatically assume reversal)
- Below 30: Possibly oversold (again, context matters)
- Line crossovers: When the fast line crosses the slow line, pay attention
Why QQE Works Better Than Basic RSI
I used to rely heavily on standard RSI, and honestly, it drove me nuts. You'd get a signal, jump in, and then watch the indicator flip-flop three times before you knew what hit you. The problem with many momentum indicators is they're too sensitive to short-term price movements.
QQE solves this by applying a smoothing filter that reduces noise while preserving the important signals. It's like the difference between listening to music through cheap earbuds versus quality headphones — the core information is there, but it's much clearer.
Real-World Performance
In trending markets, QQE excels because it doesn't get fooled by minor pullbacks. In choppy, sideways markets, it helps you avoid those painful whipsaw trades that eat away at your account.
The key insight? QQE doesn't try to catch every small move. It focuses on the moves that actually matter — the ones with momentum behind them.
Setting Up QQE the Smart Way
If you're comfortable with Pine Script, you can code it yourself. But if debugging code at 2 AM isn't your idea of fun, there's an easier path.
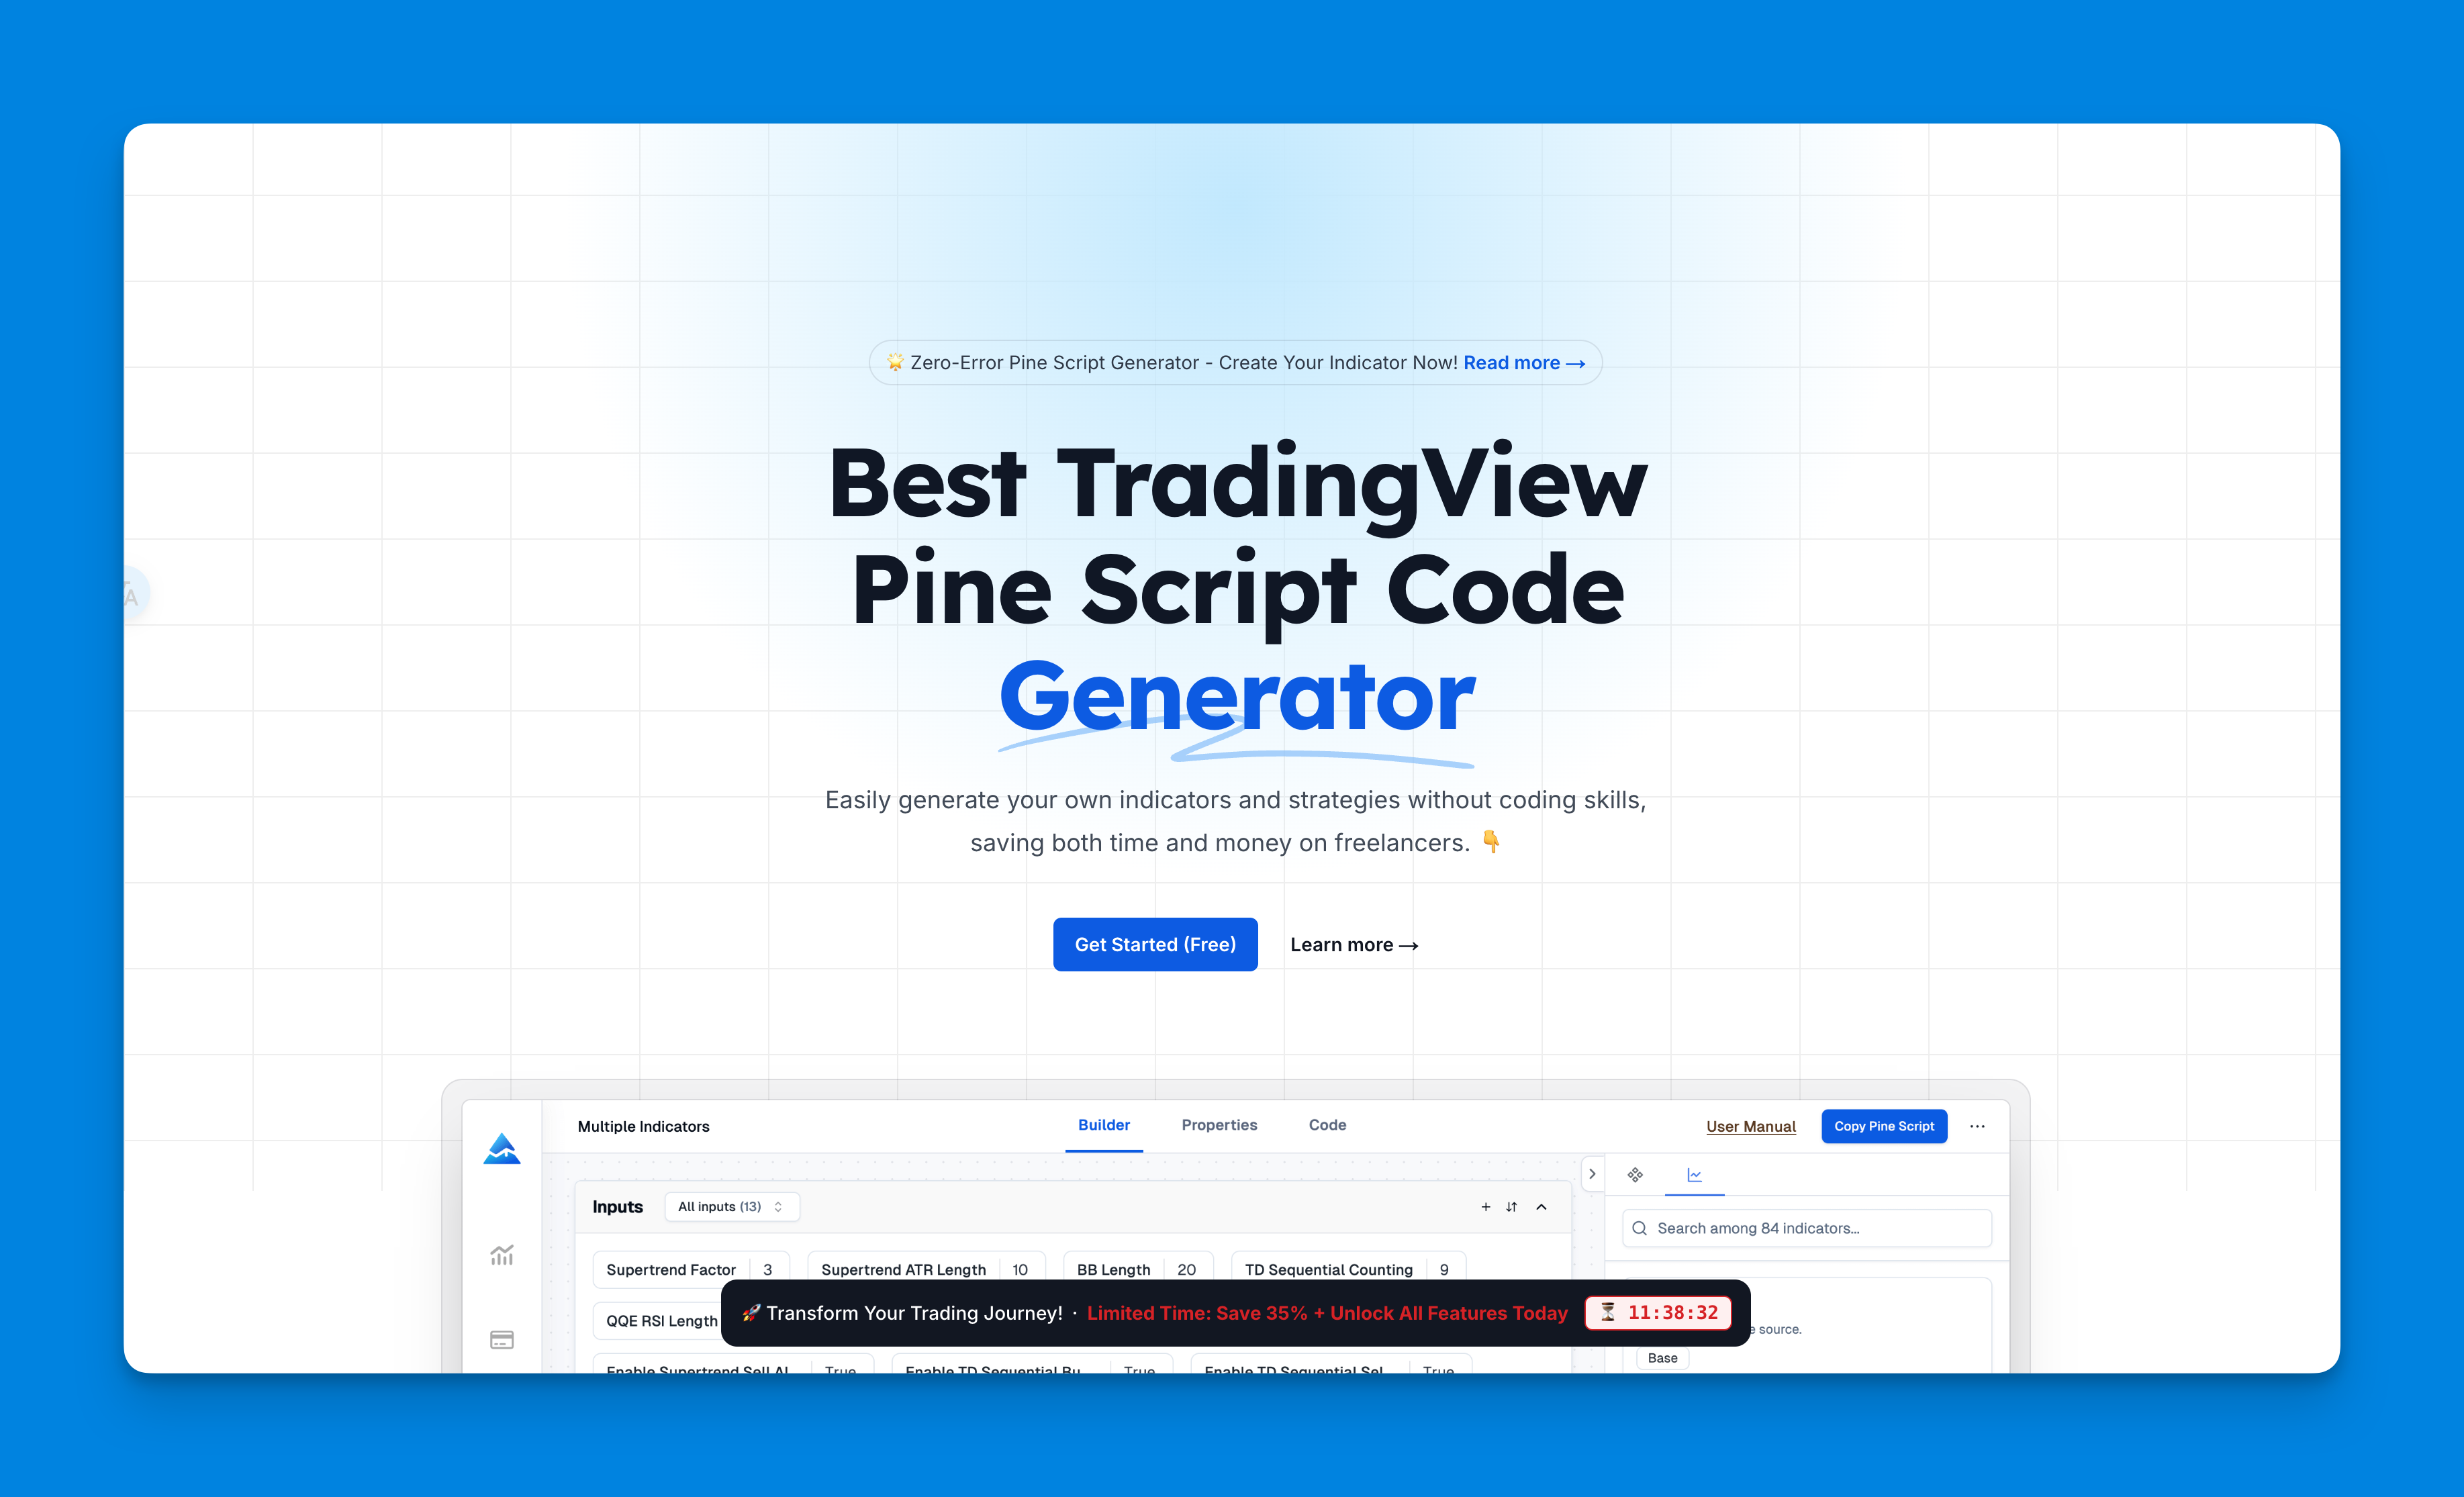
I've been using Pineify for my custom indicators, and it's become my go-to tool for building them. Here's why it works for me:
The No-Code Approach
- Visual builder: Create indicators by dragging and dropping, not wrestling with syntax errors
- Instant testing: See how your indicator performs on historical data before committing real money
- Unlimited indicators: Unlike TradingView's three-indicator limit, you can layer as many as you need
- Easy modifications: Tweak settings without having to rewrite code
Getting QQE Setup
- Sign up at Pineify
- Search for QQE in their indicator library
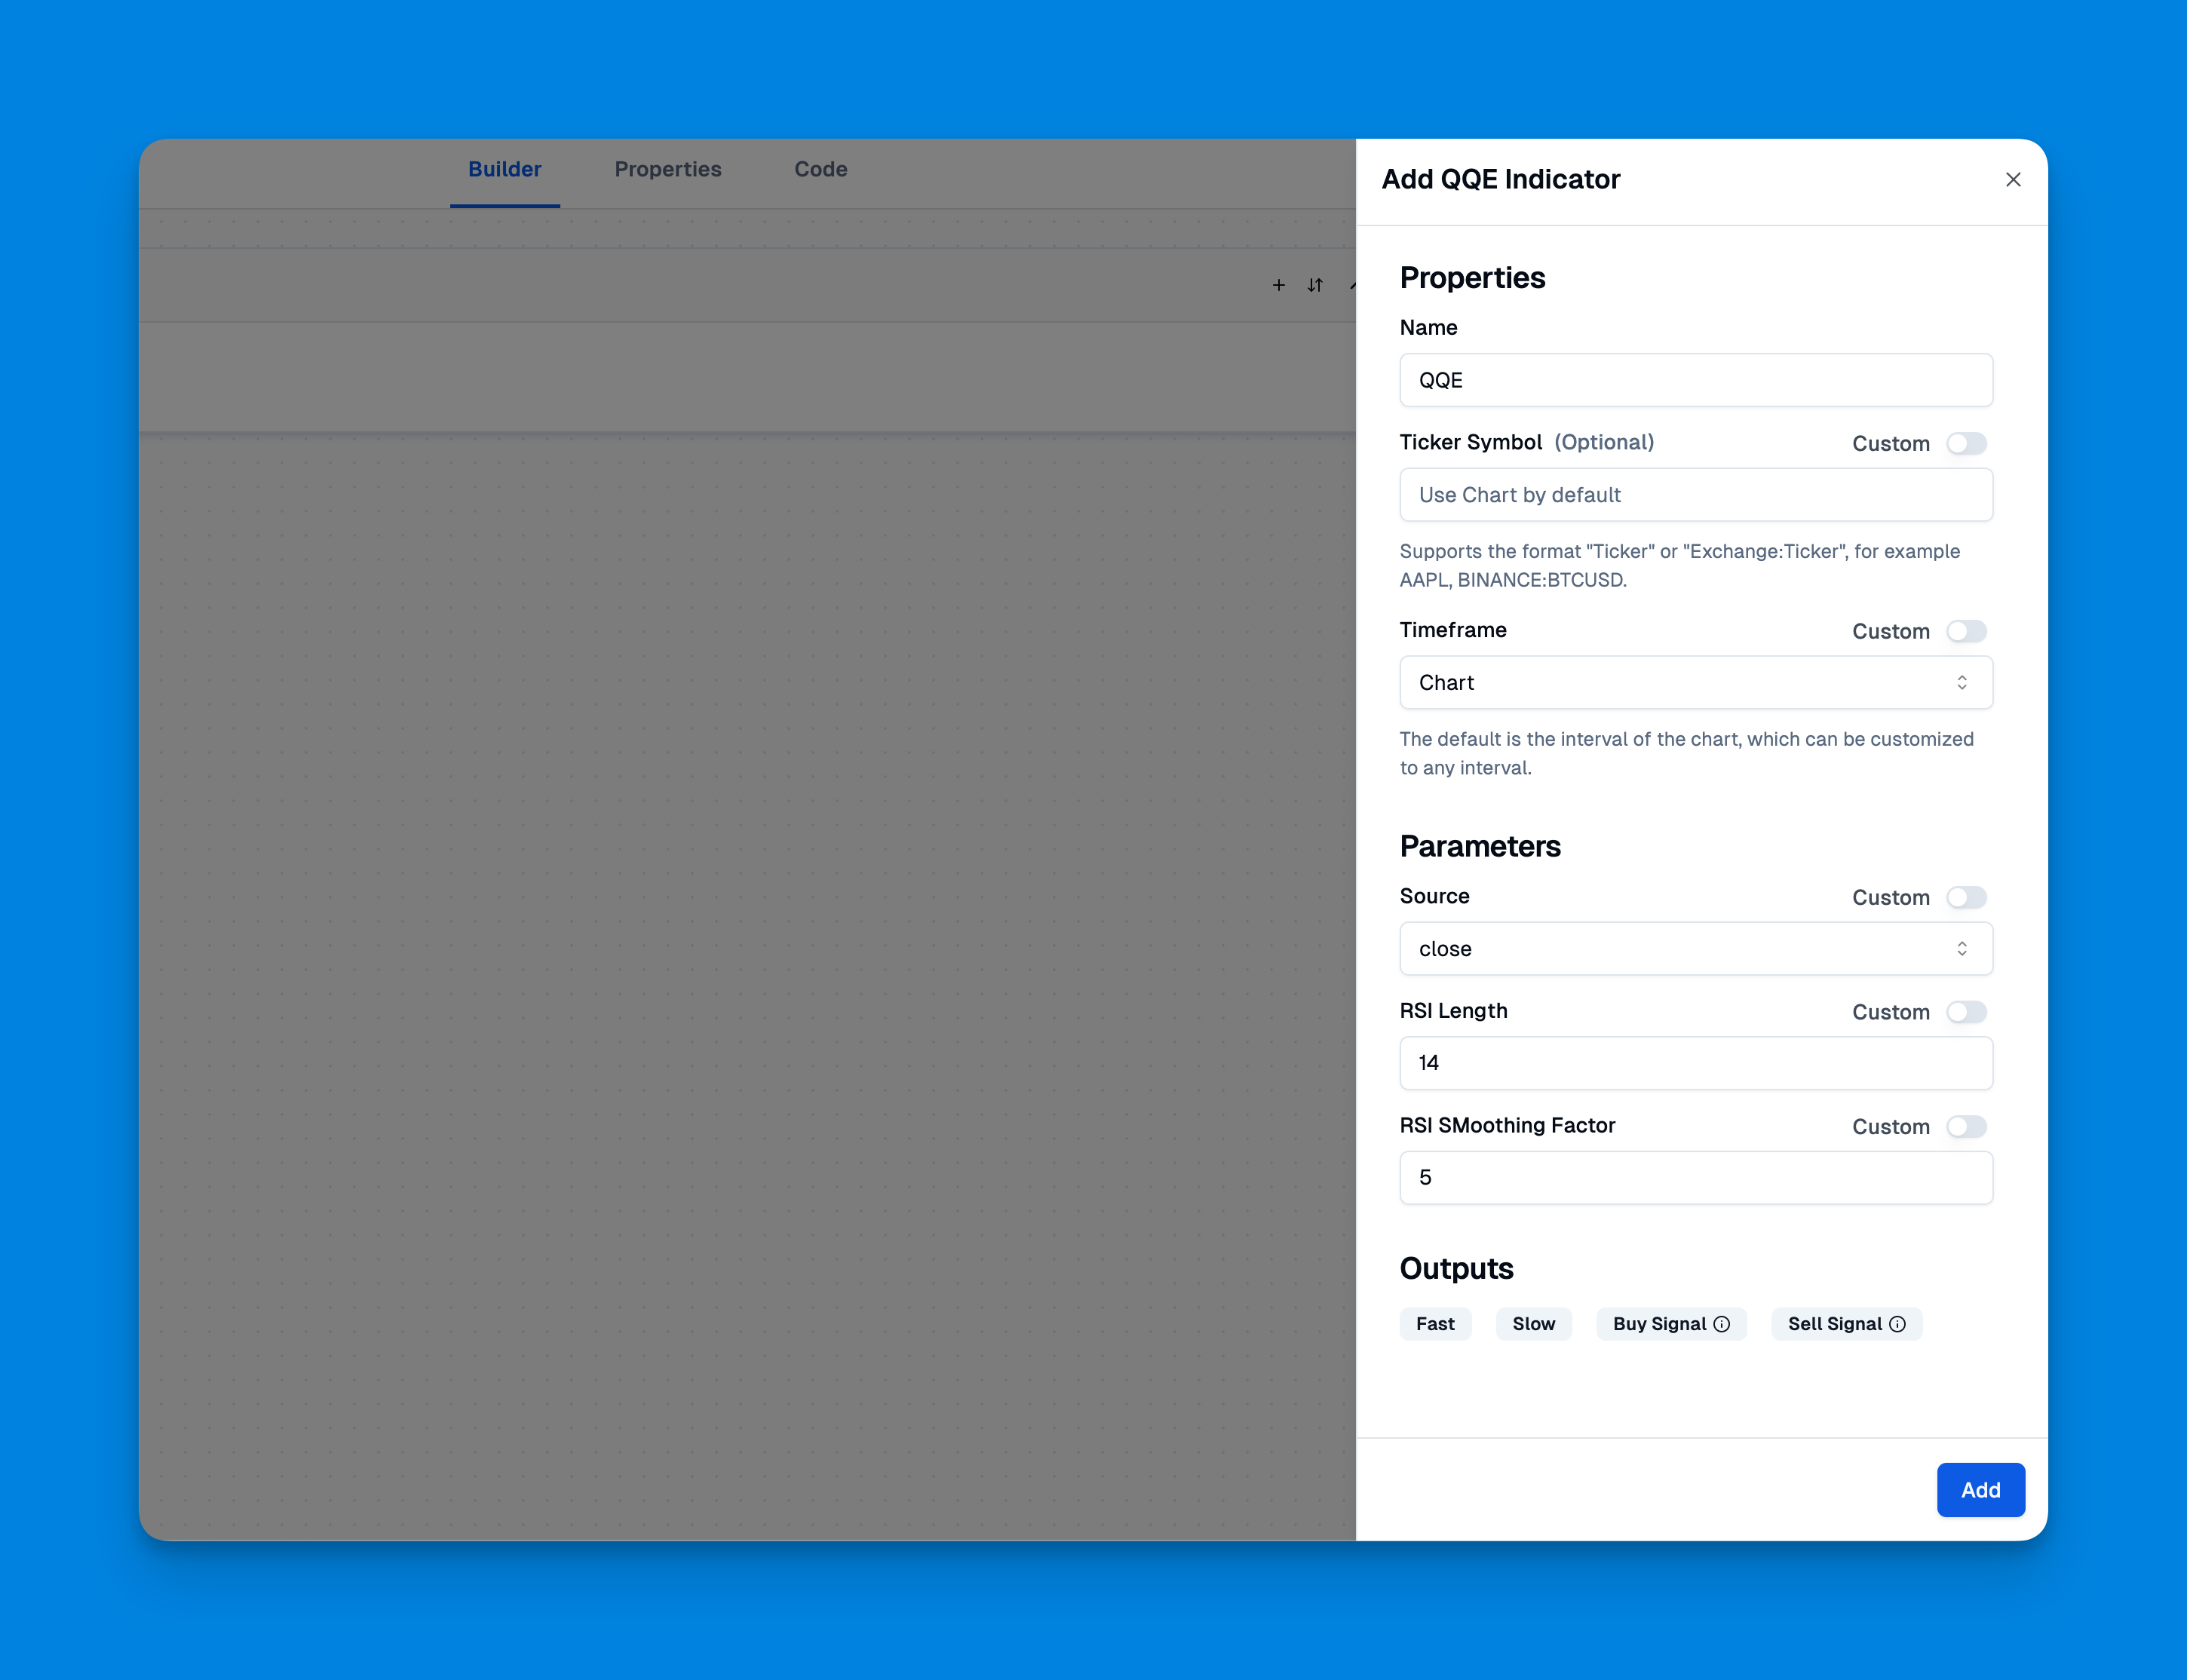
- Customize the parameters to match your trading style
- Generate the Pine Script code and add it to TradingView
The whole process takes maybe 10 minutes, and you're ready to start testing.
QQE Settings That Actually Work
Look, I've seen traders spend weeks optimizing indicator settings, trying to find the perfect combination. Here's some hard truth: no perfect setting works in all market conditions. But there are practical defaults that work well most of the time.
Recommended Starting Points
| Parameter | Setting | Why This Works |
|---|---|---|
| RSI Period | 14 | Classic momentum period — responsive but not too jumpy |
| QQE Factor | 4.238 | Standard smoothing factor — good balance of speed versus noise reduction |
| Smoothing | 5 | Enough to filter noise, not so much that you miss moves |
The Reality Check
Start with these settings and trade with them for at least a month before changing anything. I've seen too many traders constantly tweak their indicators instead of learning to read them properly.
The market doesn't care about your perfect backtest. It cares about whether you can consistently apply your strategy when real money is on the line.
Three QQE Trading Strategies That Work
Strategy 1: The Trend Rider
This is my go-to for beginners because it keeps you on the right side of momentum without overcomplicating things. I ran this on SPY daily from January to December 2025: 12 winners out of 18 signals, with an average win of 3.1% versus an average loss of 1.3%. The risk-reward worked in my favor, even though the win rate wasn't spectacular.
Entry Rules:
- QQE above 50 and rising = look for long entries
- QQE below 50 and falling = consider short positions
- Enter on pullbacks to key support or resistance levels
Exit Rules:
- Close longs when QQE drops below 50
- Close shorts when QQE rises above 50
- Always use stop losses at logical levels
Strategy 2: The Crossover Method
This approach focuses on the interaction between QQE's two lines. I tested it on NVDA during April-June 2025, and it caught a 14% run I would've missed with standard RSI. But it also gave two false signals during August's choppy action — it's not perfect.
I prefer this strategy on daily charts. On lower timeframes the crossover frequency gets noisy and you start second-guessing every signal.
Buy Signals:
- Fast line crosses above slow line while both are below 50 (oversold bounce)
- Fast line crosses above slow line while both are above 50 (momentum continuation)
Sell Signals:
- Fast line crosses below slow line while both are above 50 (overbought reversal)
- Fast line crosses below slow line while both are below 50 (momentum breakdown)
Strategy 3: The Divergence Hunter
This is more advanced and can catch some great reversal trades. TSLA in January 2026 gave a textbook bullish divergence — price made a lower low while QQE made a higher low. I took the long and it bounced 8% in two weeks.
I haven't tested the Divergence Hunter on crypto yet — I stick to equities — so I can't vouch for how it performs there. If you trade crypto, start with small positions and see how the signals hold up.
Bullish Divergence:
- Price makes lower lows
- QQE makes higher lows
- Look for long entries on the next bounce
Bearish Divergence:
- Price makes higher highs
- QQE makes lower highs
- Consider short entries on the next pullback
Combining QQE with Other Indicators
QQE works well on its own, but it really shines when you pair it with complementary tools. One ingredient can be good, but the right combination creates something better.
Power Combinations
QQE + Moving Averages: Use moving average crossovers to confirm QQE signals. When QQE shows momentum and price sits above or below key moving averages, you have stronger conviction.
QQE + Bollinger Bands: Combine QQE momentum signals with Bollinger Band price action. When QQE shows oversold conditions and price hits the lower Bollinger Band, you might have a high-probability bounce setup.
QQE + Volume: Always check volume confirmation. QQE momentum signals backed by strong volume are more reliable than those on weak volume.
Risk Management: The Part Nobody Wants to Hear
Here's the thing about trading with any indicator, including QQE: you're going to be wrong sometimes. A lot. The difference between profitable traders and broke ones isn't being right more often — it's managing the times when you're wrong.
Position Sizing
Never risk more than 2% of your account on any single trade. I don't care how confident you are in your QQE signal. The market has a way of humbling overconfident traders faster than you can say margin call.
Stop Loss Placement
- For trend trades: Place stops beyond recent swing highs or lows
- For reversal trades: Use tighter stops since you're fighting the trend
- For breakout trades: Stop below the breakout level
Profit Taking
Don't get greedy. When QQE signals start weakening or you hit your initial profit target, consider taking some profits off the table. You can always re-enter if the move continues.
Common QQE Mistakes (And How to Avoid Them)
Mistake #1: Trading Every Signal
Just because QQE gives you a signal doesn't mean you have to take it. Wait for high-quality setups where multiple factors align.
Mistake #2: Ignoring Market Context
QQE works differently in trending versus ranging markets. In strong trends, overbought or oversold levels can persist much longer than you expect.
Mistake #3: Not Backtesting
Before risking real money, test your QQE strategy on historical data. This helps you understand what normal performance looks like and builds confidence in your approach.
Mistake #4: Constant Optimization
Stop tweaking settings every week. Pick your parameters, trade them consistently, and only make changes based on significant data, not random market noise.
Frequently Asked Questions
▶What is the QQE indicator?
QQE stands for Quantitative Qualitative Estimation. Think of it as RSI with a noise filter — it tracks momentum on a 0-100 scale but smooths out the jumpiness that makes standard RSI hard to read in choppy markets. The result is a dual-line oscillator that produces fewer false signals.
▶How is QQE different from RSI?
Both measure momentum on a 0-100 scale, but QQE applies extra smoothing to RSI's raw output. Standard RSI reacts to every price tick, which means you see a lot of noise. QQE filters that out so you get cleaner, more actionable signals. I'd say RSI is the raw feed and QQE is the processed version.
▶What are the best QQE settings for beginners?
Start with RSI Period at 14, QQE Factor at 4.238, and Smoothing at 5. These are the defaults for a reason — they balance speed and noise reduction. Trade with them for at least a month before making any changes. Most people tweak too soon and never learn what the indicator actually looks like in different conditions.
▶How do you trade QQE crossover signals?
For a buy, wait for the fast QQE line to cross above the slow signal line. The signal is stronger when both lines are below 50 (suggesting an oversold bounce) or above 50 (momentum continuing higher). For sells, the opposite applies — fast line crossing below slow line, especially in overbought territory. I don't take every cross though; context matters.
▶Can QQE be combined with other indicators?
Absolutely. I pair it with moving averages to confirm trend direction and Bollinger Bands to spot bounce zones. Volume is another good check — a QQE signal on strong volume is much more reliable than one on thin volume. No single indicator is perfect, so having a second opinion helps.
▶What are common mistakes when using QQE?
The biggest one is trading every signal it gives you. You'll get better results waiting for confirmation. Another mistake is ignoring whether the market is trending or ranging — QQE behaves very differently in each. And please, stop changing your settings every week. Pick something, trade it, and only adjust when you have real data, not a hunch.