Multi-Timeframe SuperTrend Indicator for TradingView Pine Script

The Supertrend Multi-Timeframe Indicator is an advanced trading tool designed to provide traders with a comprehensive view of market trends across two different timeframes. By combining the power of the Supertrend indicator on both the current chart timeframe and a larger timeframe, this indicator offers a more robust and reliable approach to identifying potential trading opportunities.
Click below to get the indicator code for free.

Best AI Pine Script Generator and Code Editor for TradingView
Key Features

Dual Timeframe Analysis:
This indicator implements the Supertrend algorithm on two distinct timeframes simultaneously:
- The current chart timeframe
- A larger, user-defined timeframe
Visual Representation:
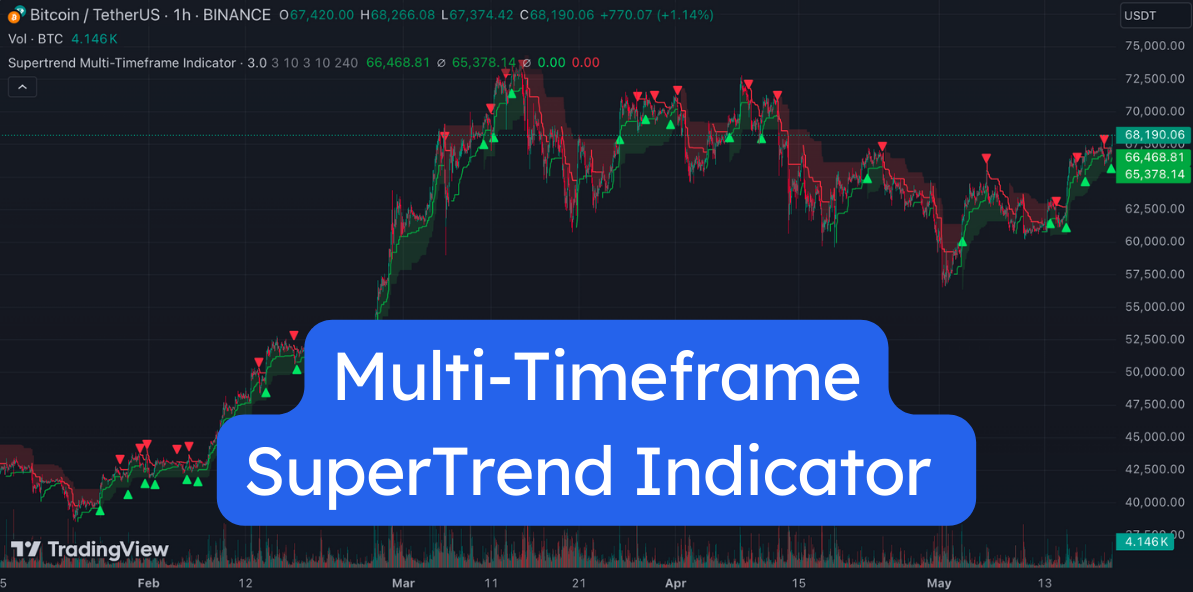
The indicator displays trend directions using color-coded backgrounds and lines:
- Green: Uptrend
- Red: Downtrend
Buy and Sell Signals:
Clear visual cues are provided for potential entry and exit points:
- Upward-pointing triangle (▲): Buy signal
- Downward-pointing triangle (▼): Sell signal
Customizable Parameters:
Users can fine-tune the indicator by adjusting:
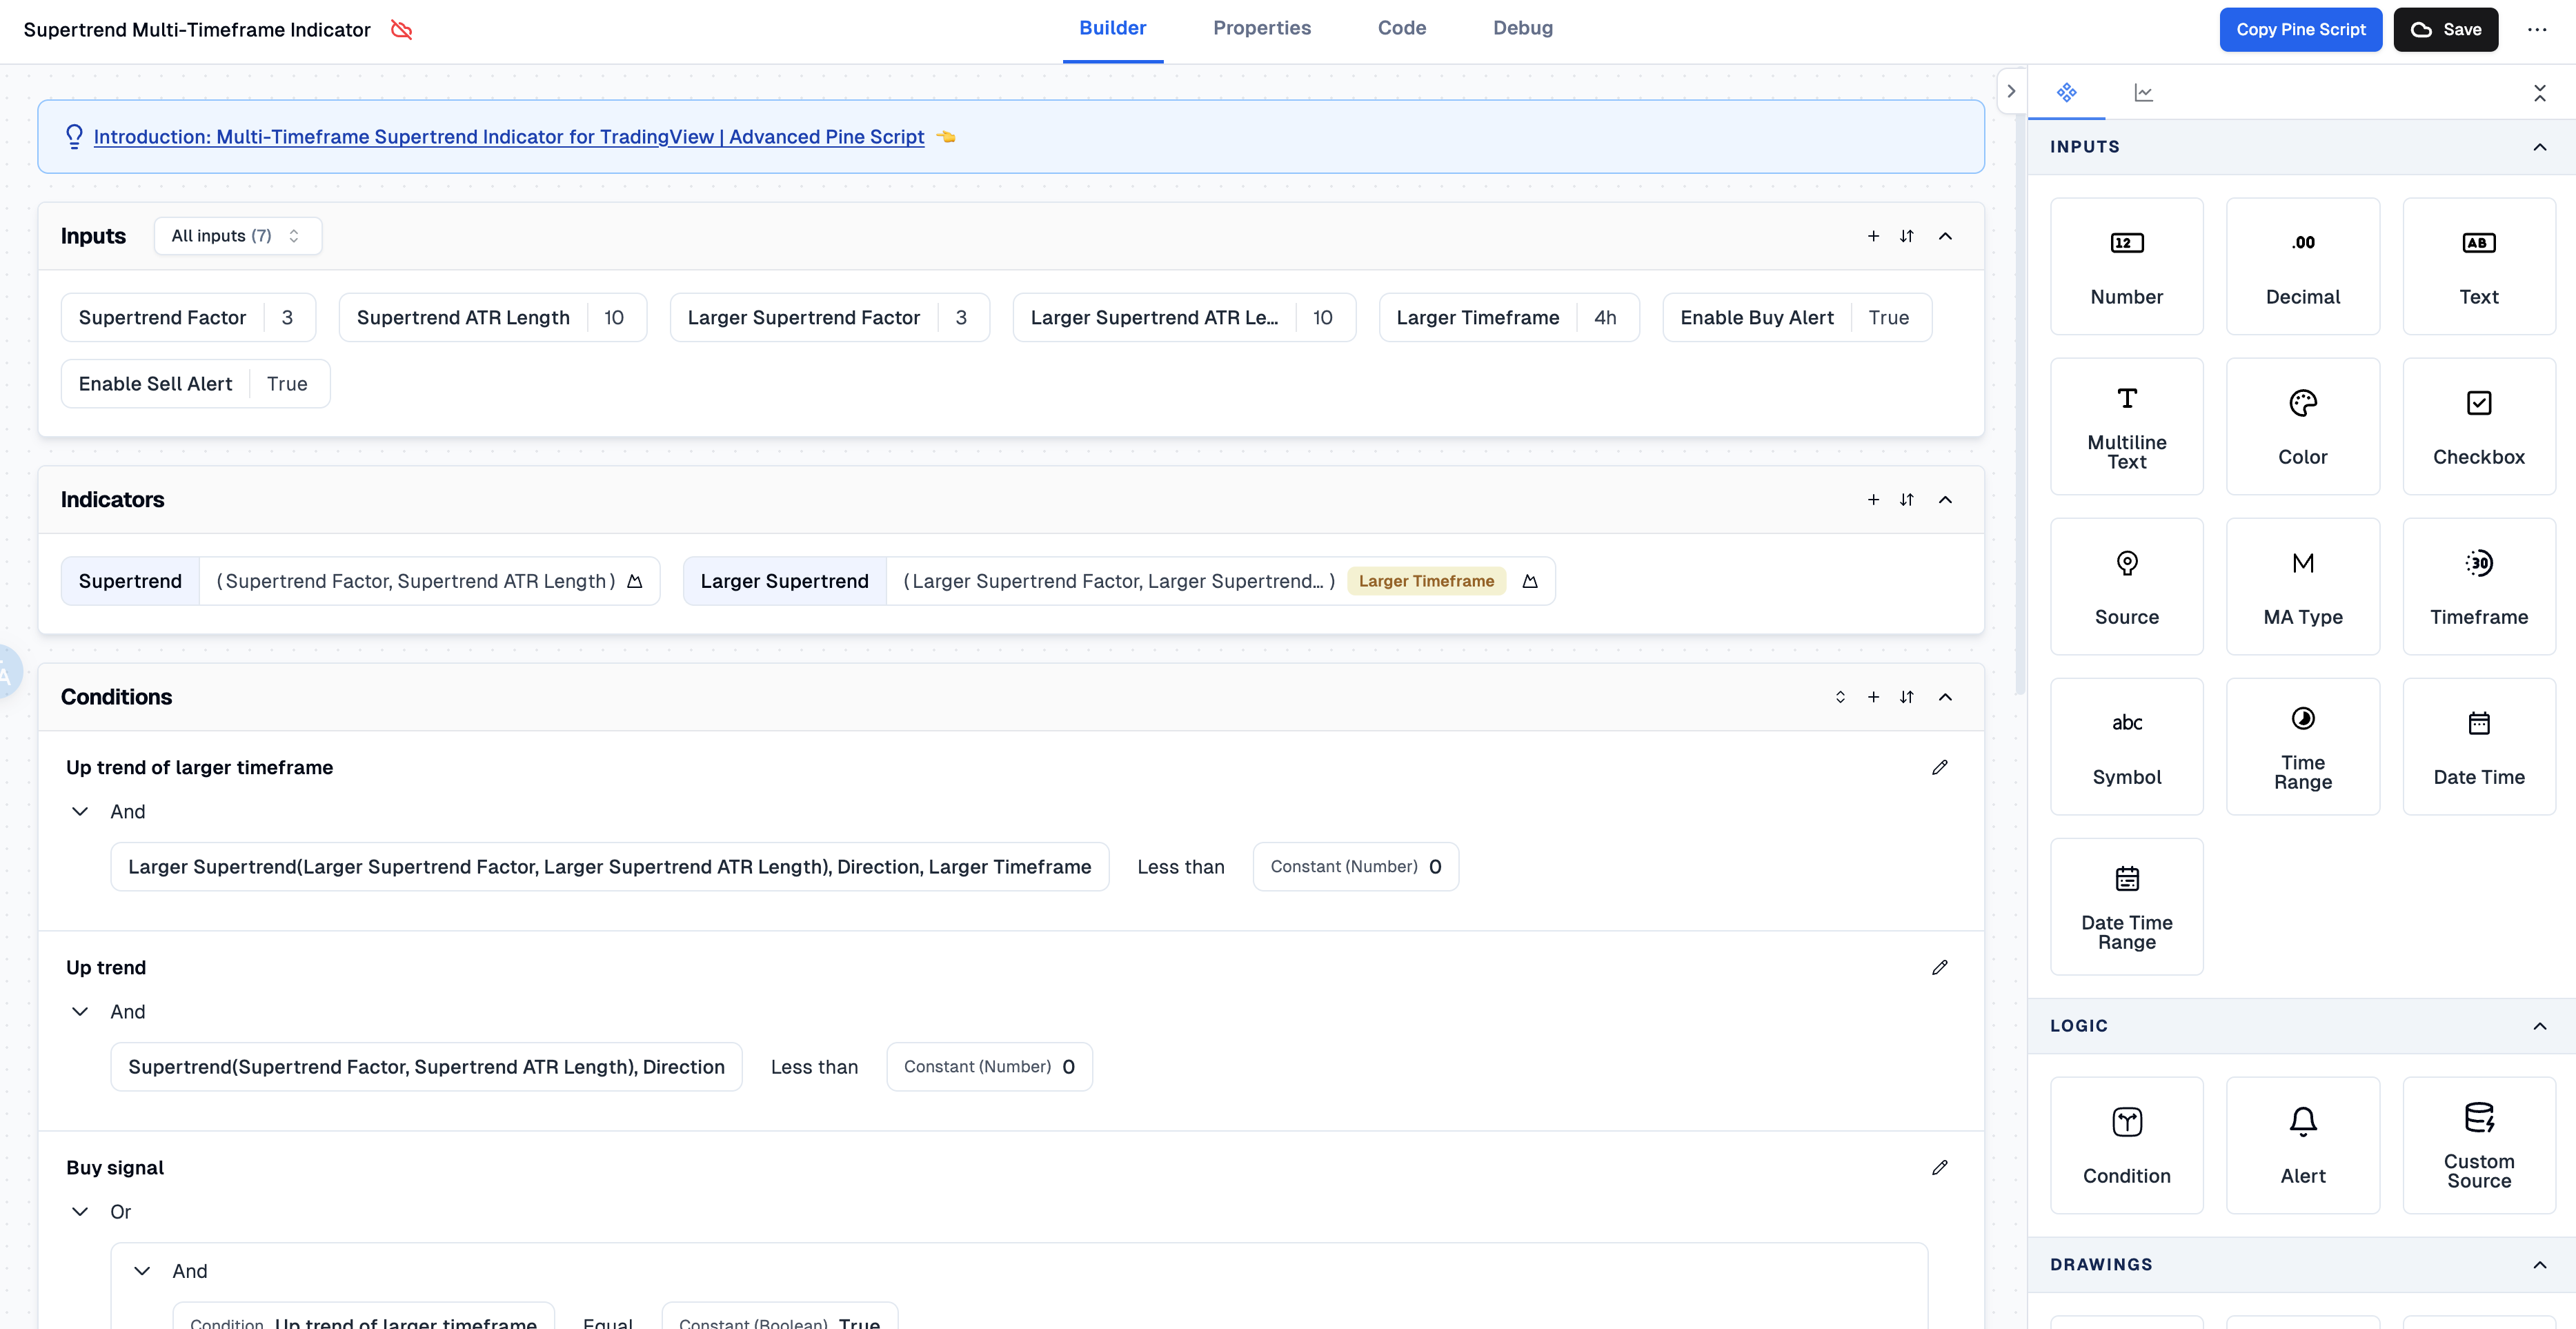
- Supertrend factors for both timeframes
- ATR (Average True Range) lengths for both timeframes
- The larger timeframe for comparison
Alert System:
Optional alerts for buy and sell signals to keep traders informed of potential opportunities
How It Works
The Supertrend Multi-Timeframe Indicator operates on the following principles:
- Supertrend Calculation: The indicator calculates the Supertrend for both the current chart timeframe and the specified larger timeframe. The Supertrend is a popular trend-following indicator that combines the Average True Range (ATR) with a multiplier to determine potential support and resistance levels.
- Trend Direction: The direction of the trend is determined by the position of the price relative to the Supertrend line. When the price is above the Supertrend line, it's considered an uptrend (green). When below, it's a downtrend (red).
- Signal Generation:
- Buy Signal: Triggered when either:a) The larger timeframe is in an uptrend, and the current timeframe crosses into an uptrend.b) The current timeframe is in an uptrend, and the larger timeframe crosses into an uptrend.
- Sell Signal: Occurs when both timeframes were previously in an uptrend, and either one shifts to a downtrend.
- Visual Representation: The indicator uses color-coded backgrounds and lines to clearly display the trend direction on both timeframes. This allows traders to quickly assess the overall market sentiment and potential trend strength.
How to Use the Indicator
- Apply the Indicator: Add the Supertrend Multi-Timeframe Indicator to your chart.
- Adjust Parameters: Fine-tune the settings to match your trading style and the specific asset you're trading:
- Supertrend Factor: Controls the sensitivity of the indicator (default: 3 for current timeframe, 3 for larger timeframe)
- ATR Length: Determines the period for ATR calculation (default: 10 for both timeframes)
- Larger Timeframe: Select the higher timeframe for comparison (default: 240 minutes)
- Interpret the Signals:
- Look for confluence between the two timeframes. The strongest signals often occur when both timeframes align.
- Buy signals (▲) suggest potential entry points for long positions.
- Sell signals (▼) indicate potential exit points or opportunities for short positions.
- Use in Conjunction with Other Analysis: While this indicator provides valuable insights, it's recommended to use it alongside other technical analysis tools and fundamental research for a comprehensive trading approach.
- Customize Alerts: Enable or disable buy and sell alerts based on your preferences to stay informed of potential trading opportunities.
Benefits and Considerations
Benefits:
- Multi-timeframe analysis provides a more comprehensive view of market trends.
- Visual representation makes it easy to quickly assess market conditions.
- Customizable parameters allow for adaptation to different trading styles and assets.
- Alert system helps traders stay on top of potential opportunities.
Considerations:
- As with all indicators, false signals can occur, especially in choppy or sideways markets.
- The effectiveness of the indicator may vary depending on the asset and market conditions.
- It's crucial to combine this indicator with proper risk management techniques and additional analysis methods.
By leveraging the power of multi-timeframe analysis, the Supertrend Multi-Timeframe Indicator aims to provide traders with a more robust tool for identifying trends and potential trading opportunities. Whether you're a day trader, swing trader, or long-term investor, this indicator can be a valuable addition to your technical analysis toolkit.
Pineify: TradingView Pine Script Indicator & Strategy Generator

With Pineify, you can efficiently generate buy/sell indicators and custom strategies for TradingView Pine Script code creator. The best indicator and strategy backtest builder.
And you can easily create your own indicators and strategies without any coding skills, saving both time and money on freelancers.
TradingView Indicator & Strategy Generator: https://pineify.app/
