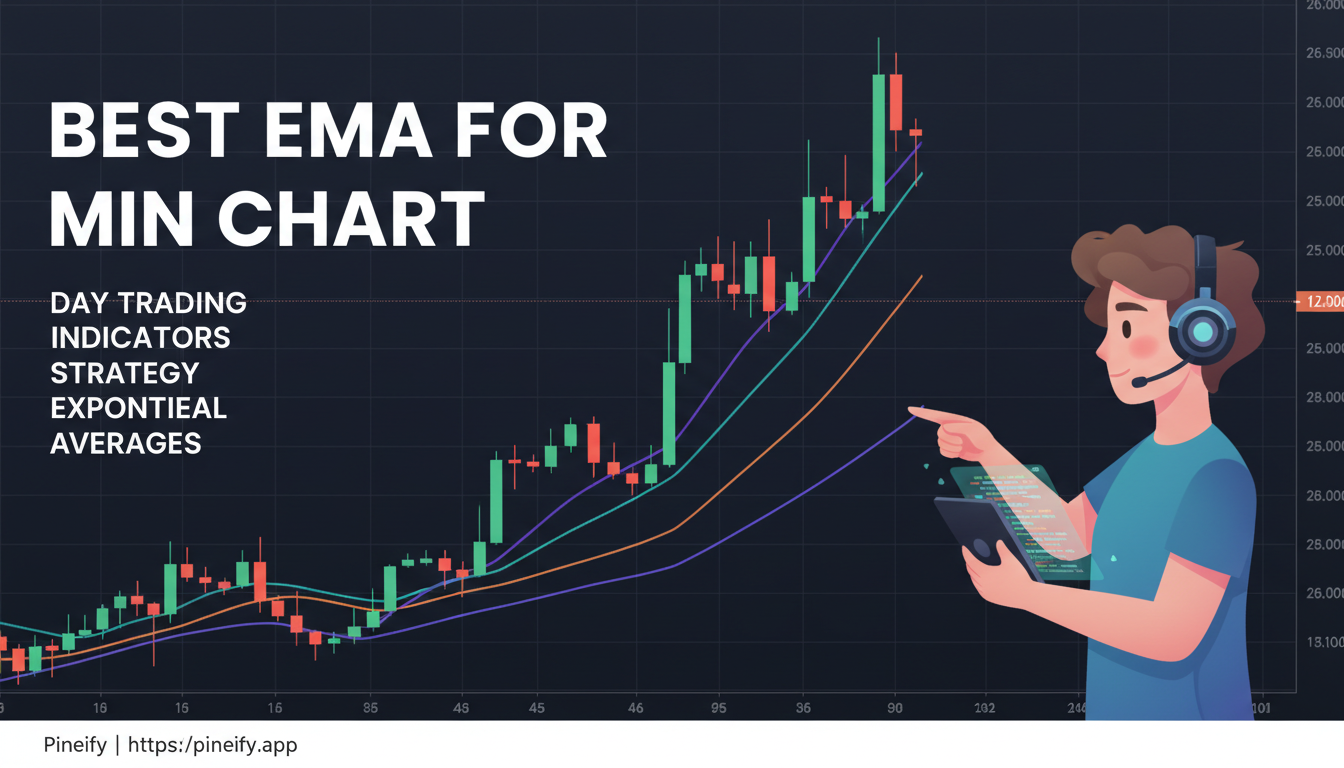
134 posts tagged with "TradingView"

Blog posts related to the TradingView

View All Tags

What is the Hull Moving Average Indicator?

· 10 min read

The Hull Moving Average (HMA) is a technical indicator used in financial markets to identify trends and generate trading signals. It combines weighted moving averages in a unique way to reduce lag while maintaining smoothness. This indicator is particularly valuable for traders who need to make quick decisions based on price movements while filtering out market noise.

Hull Moving Average Indicator on TradingView

TD Sequential (TD9) Indicator Pine Script: The Ultimate Guide

· 7 min read

The TD Sequential Indicator is a powerful tool for traders looking to identify potential trend reversals and exhaustion points in financial markets. Developed by Tom Demark, this indicator provides a structured approach to analyzing price movements through a unique counting mechanism. In this article, we will explore the TD Sequential Indicator, the innovative tool Pineify that simplifies its implementation, and how traders can effectively use these tools to enhance their trading strategies.

TD Sequential Indicator

How to Master the Bollinger Band Squeeze Indicator for Higher Profit Margins

· 5 min read

Understanding market volatility and price movements is crucial for successful trading. One of the most effective tools for this purpose is the Bollinger Bands Squeeze Indicator. This guide will delve into what the Bollinger Bands Squeeze Indicator is, how to utilize it effectively using Pineify, and the best practices for trading with this powerful indicator.

Bollinger Bands Squeeze Indicator

Best QQE Indicator Strategies for Beginner

· 5 min read

In the world of trading, having the right tools and indicators can significantly enhance your decision-making process. One such powerful tool is the Quantitative Qualitative Estimation (QQE) Indicator. This article will explore what the QQE Indicator is, how to integrate it using Pineify, and provide insights into optimal settings and trading strategies.

QQE Indicator

What is Heikin Ashi Smoothed and How Improve Your Trading?

· 5 min read

The Heikin Ashi Smoothed Indicator (HAS) is an advanced tool that enhances traditional candlestick charting by filtering out market noise and providing clearer trend signals. This article will delve into the intricacies of the Heikin Ashi Smoothed Indicator, introduce Pineify—a powerful tool for creating and managing trading indicators—and guide you on how to effectively use these tools for trading success.

What is Heikin Ashi Smoothed Indicator?

What is Know Sure Thing (KST) Indicator?

· 4 min read

The world of trading is constantly evolving, and having the right tools can make a significant difference in a trader's success. Among these tools, the Know Sure Thing (KST) Indicator and Pineify stand out for their unique capabilities. This article dives deep into what these tools are, how to use them effectively, and the best practices to optimize your trading strategies.

What is Know Sure Thing Indicator?

How to Use Pine Script SMA for More Accurate Trading Signals

· 5 min read

What is SMA Crossover Indicator?

The Simple Moving Average (SMA) Crossover Indicator is a widely-used technical analysis tool that helps traders identify potential buy and sell signals based on the interaction of two moving averages. Typically, these moving averages are calculated over different time periods—one shorter and one longer.

When the shorter SMA crosses above the longer SMA, it generates a bullish signal, indicating a potential uptrend and a good time to buy. Conversely, when the shorter SMA crosses below the longer SMA, it produces a bearish signal, suggesting a downtrend and an opportunity to sell. This method smooths out price fluctuations, making it easier to spot trends and reversals in the market.

SMA Crossover Indicator Chart

How to Code EMA Crossover Pine Script for Trading Wins

· 5 min read

The Exponential Moving Average Cross (pine script price above ema​) Indicator is a powerful tool used in trading to identify potential buy and sell signals based on the crossover of two EMAs. This article will introduce Pineify—a no-code tool for creating custom indicators—and guide you through adding the EMA Cross Indicator using Pineify, optimal settings, and practical trading strategies.

Add EMA Cross Indicator using Pineify

QQE Indicator: A Comprehensive Trading Guide

· 5 min read

The Quantitative Qualitative Estimation (QQE) indicator is a powerful tool used in technical analysis to help traders identify market trends, overbought and oversold conditions, and potential entry and exit points. This article will delve into the intricacies of the QQE indicator, its applications in trading, and how it compares to other popular indicators like the Relative Strength Index (RSI).

QQE Indicator