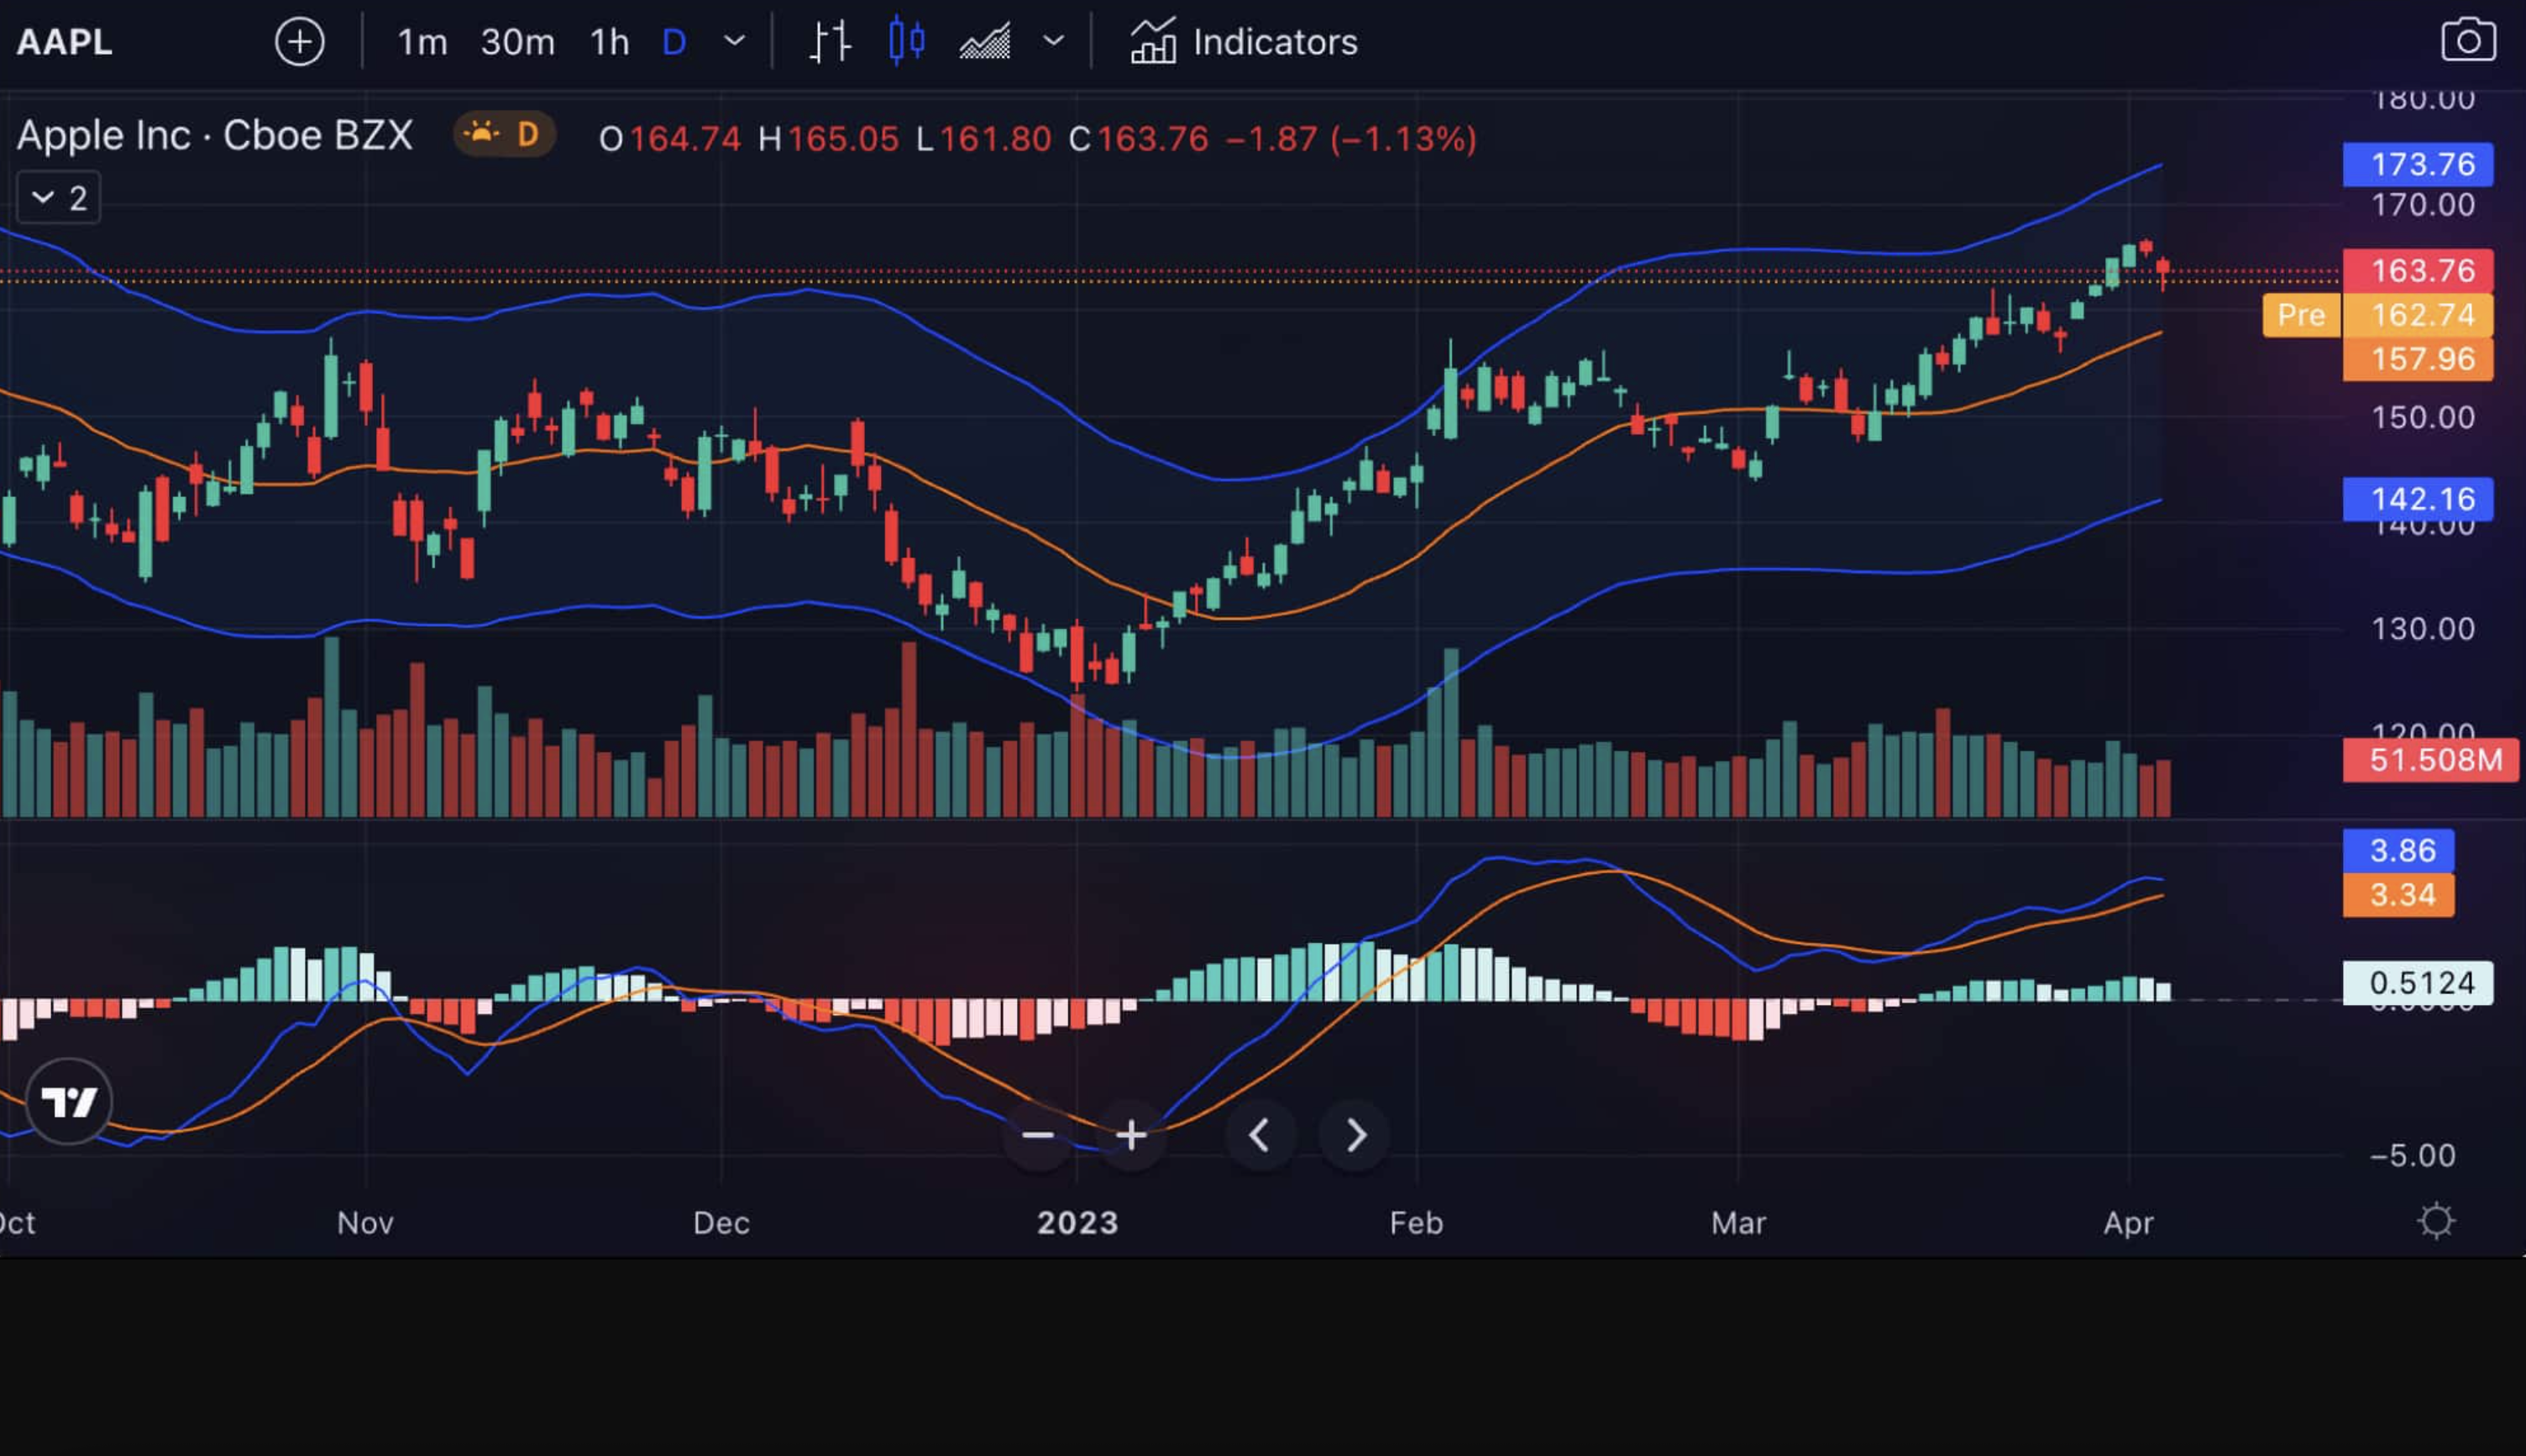
Ever looked at a candlestick chart during choppy market conditions and felt like you were trying to find a trend in pure chaos? I've spent hours squinting at noise-filled charts on the SPY 5-minute, missing good setups because the price action was too erratic to read clearly.
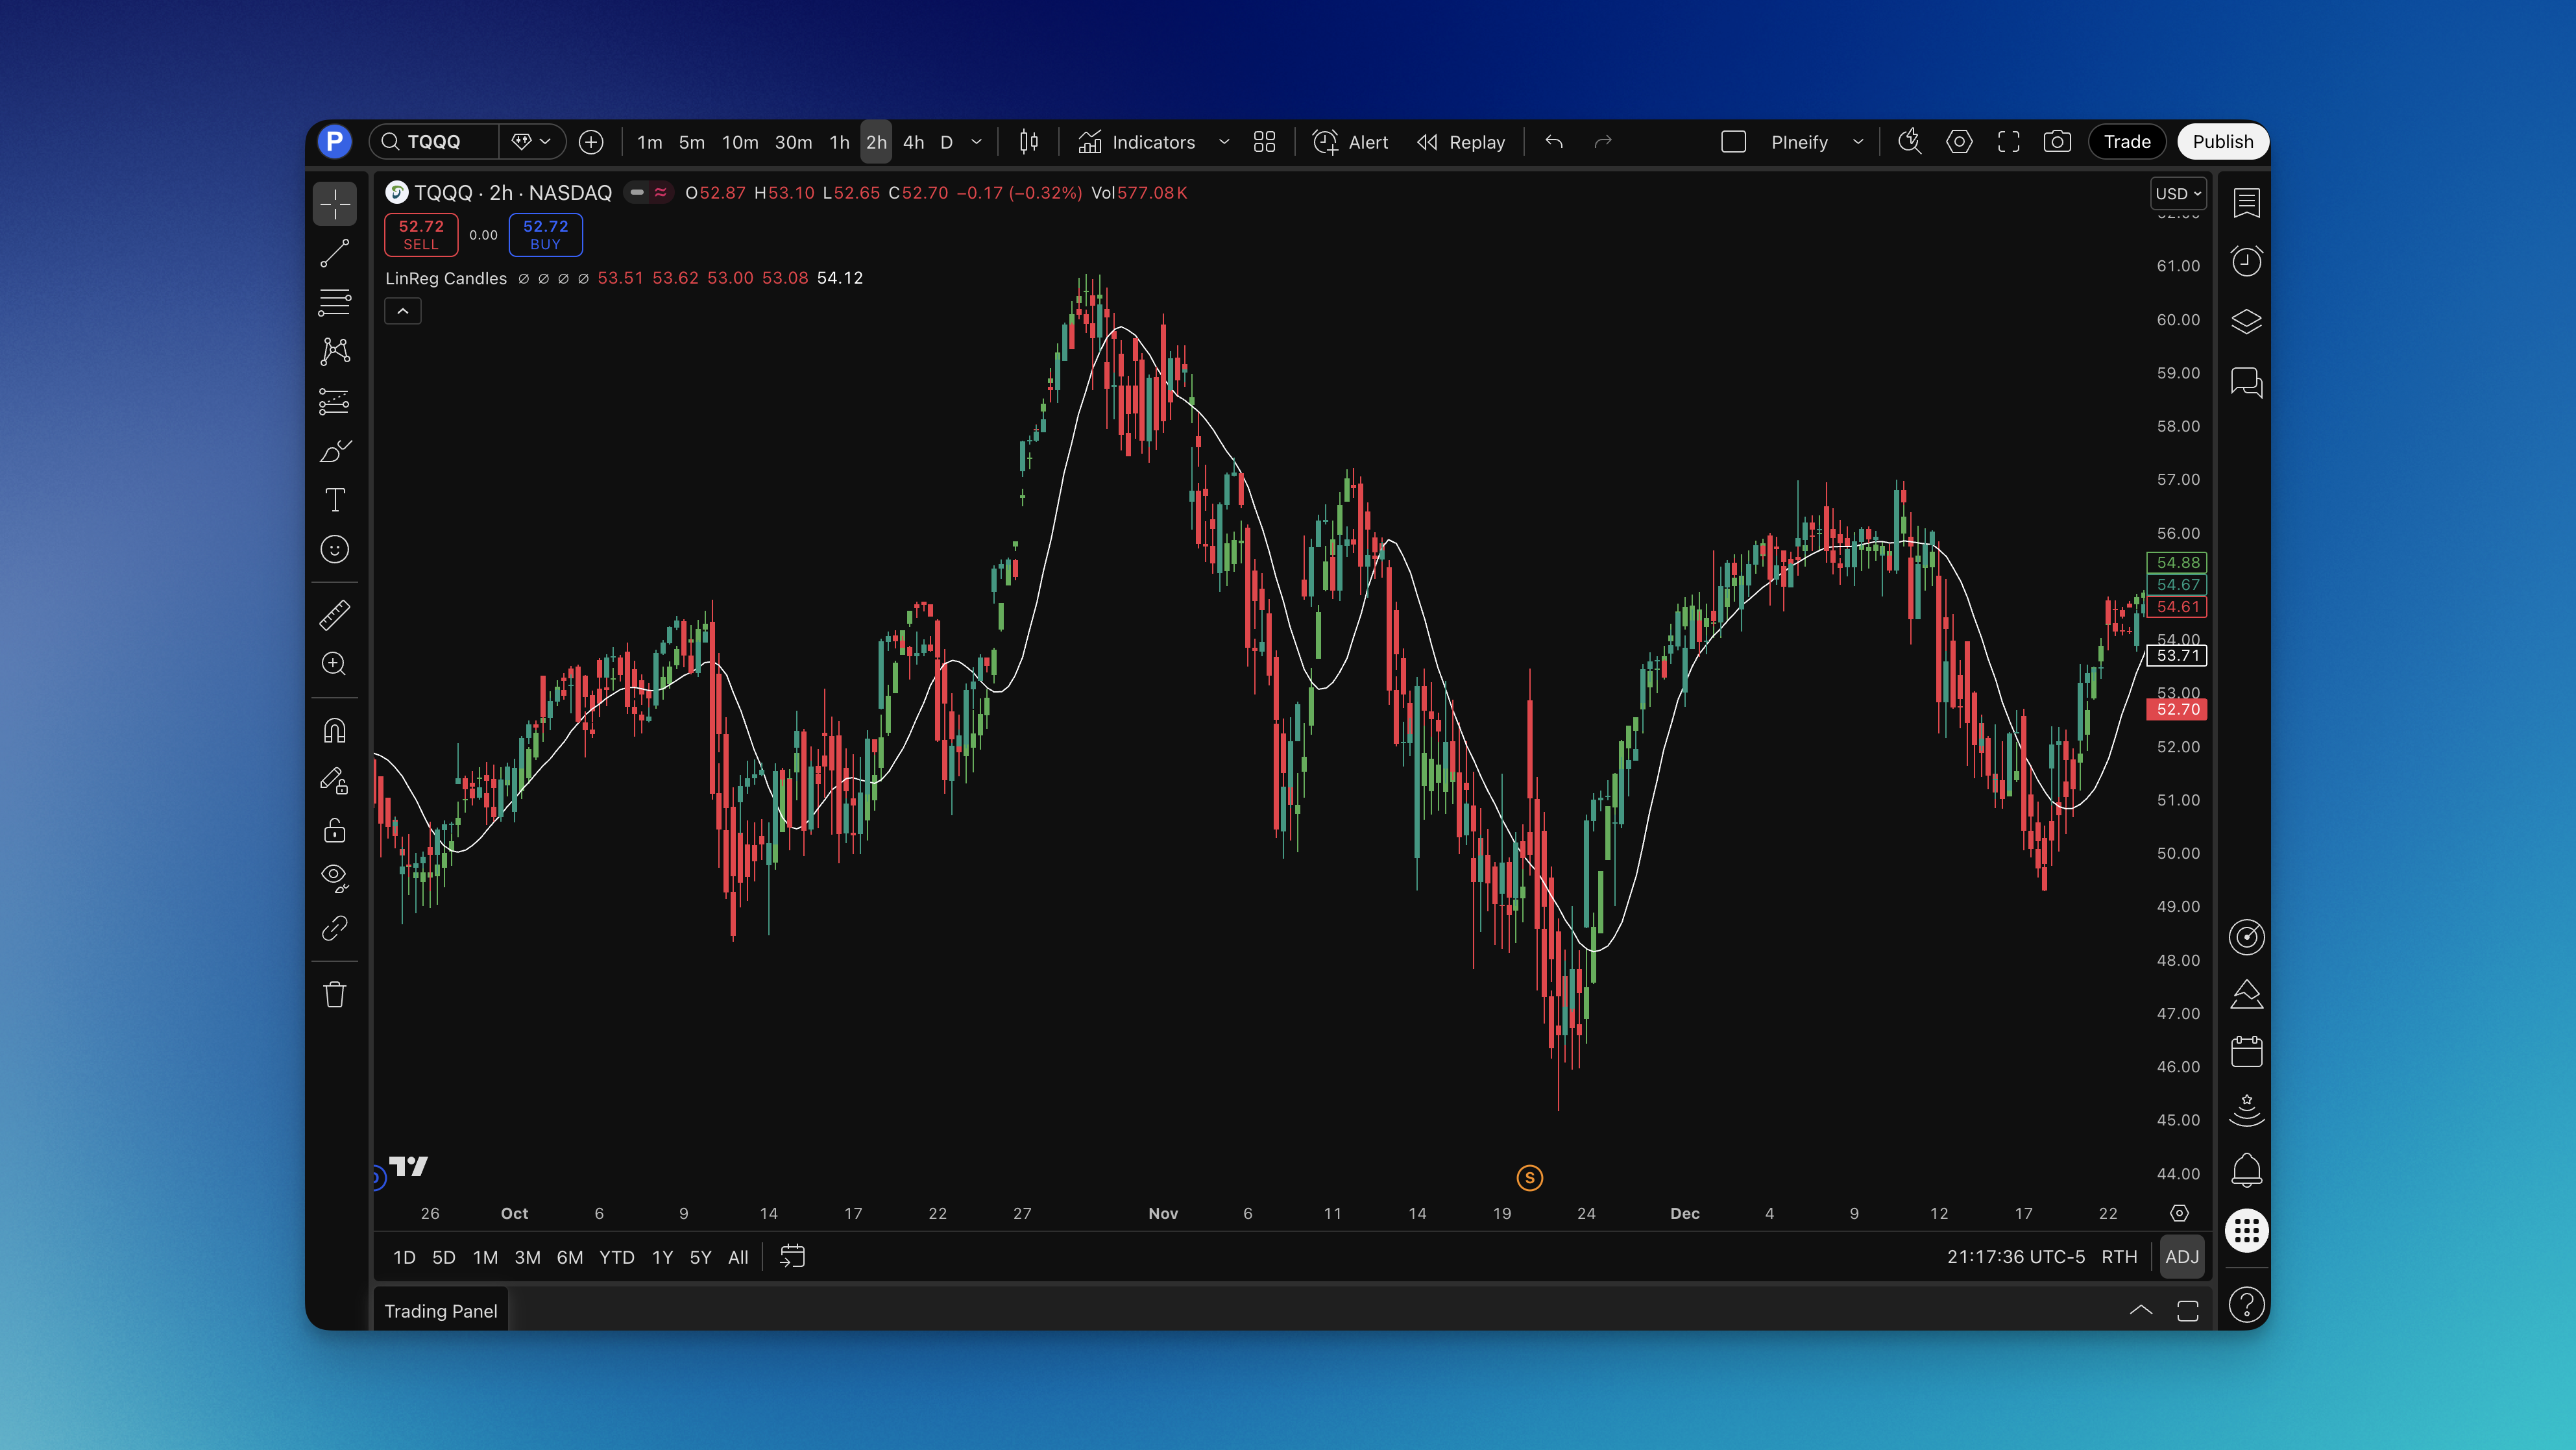
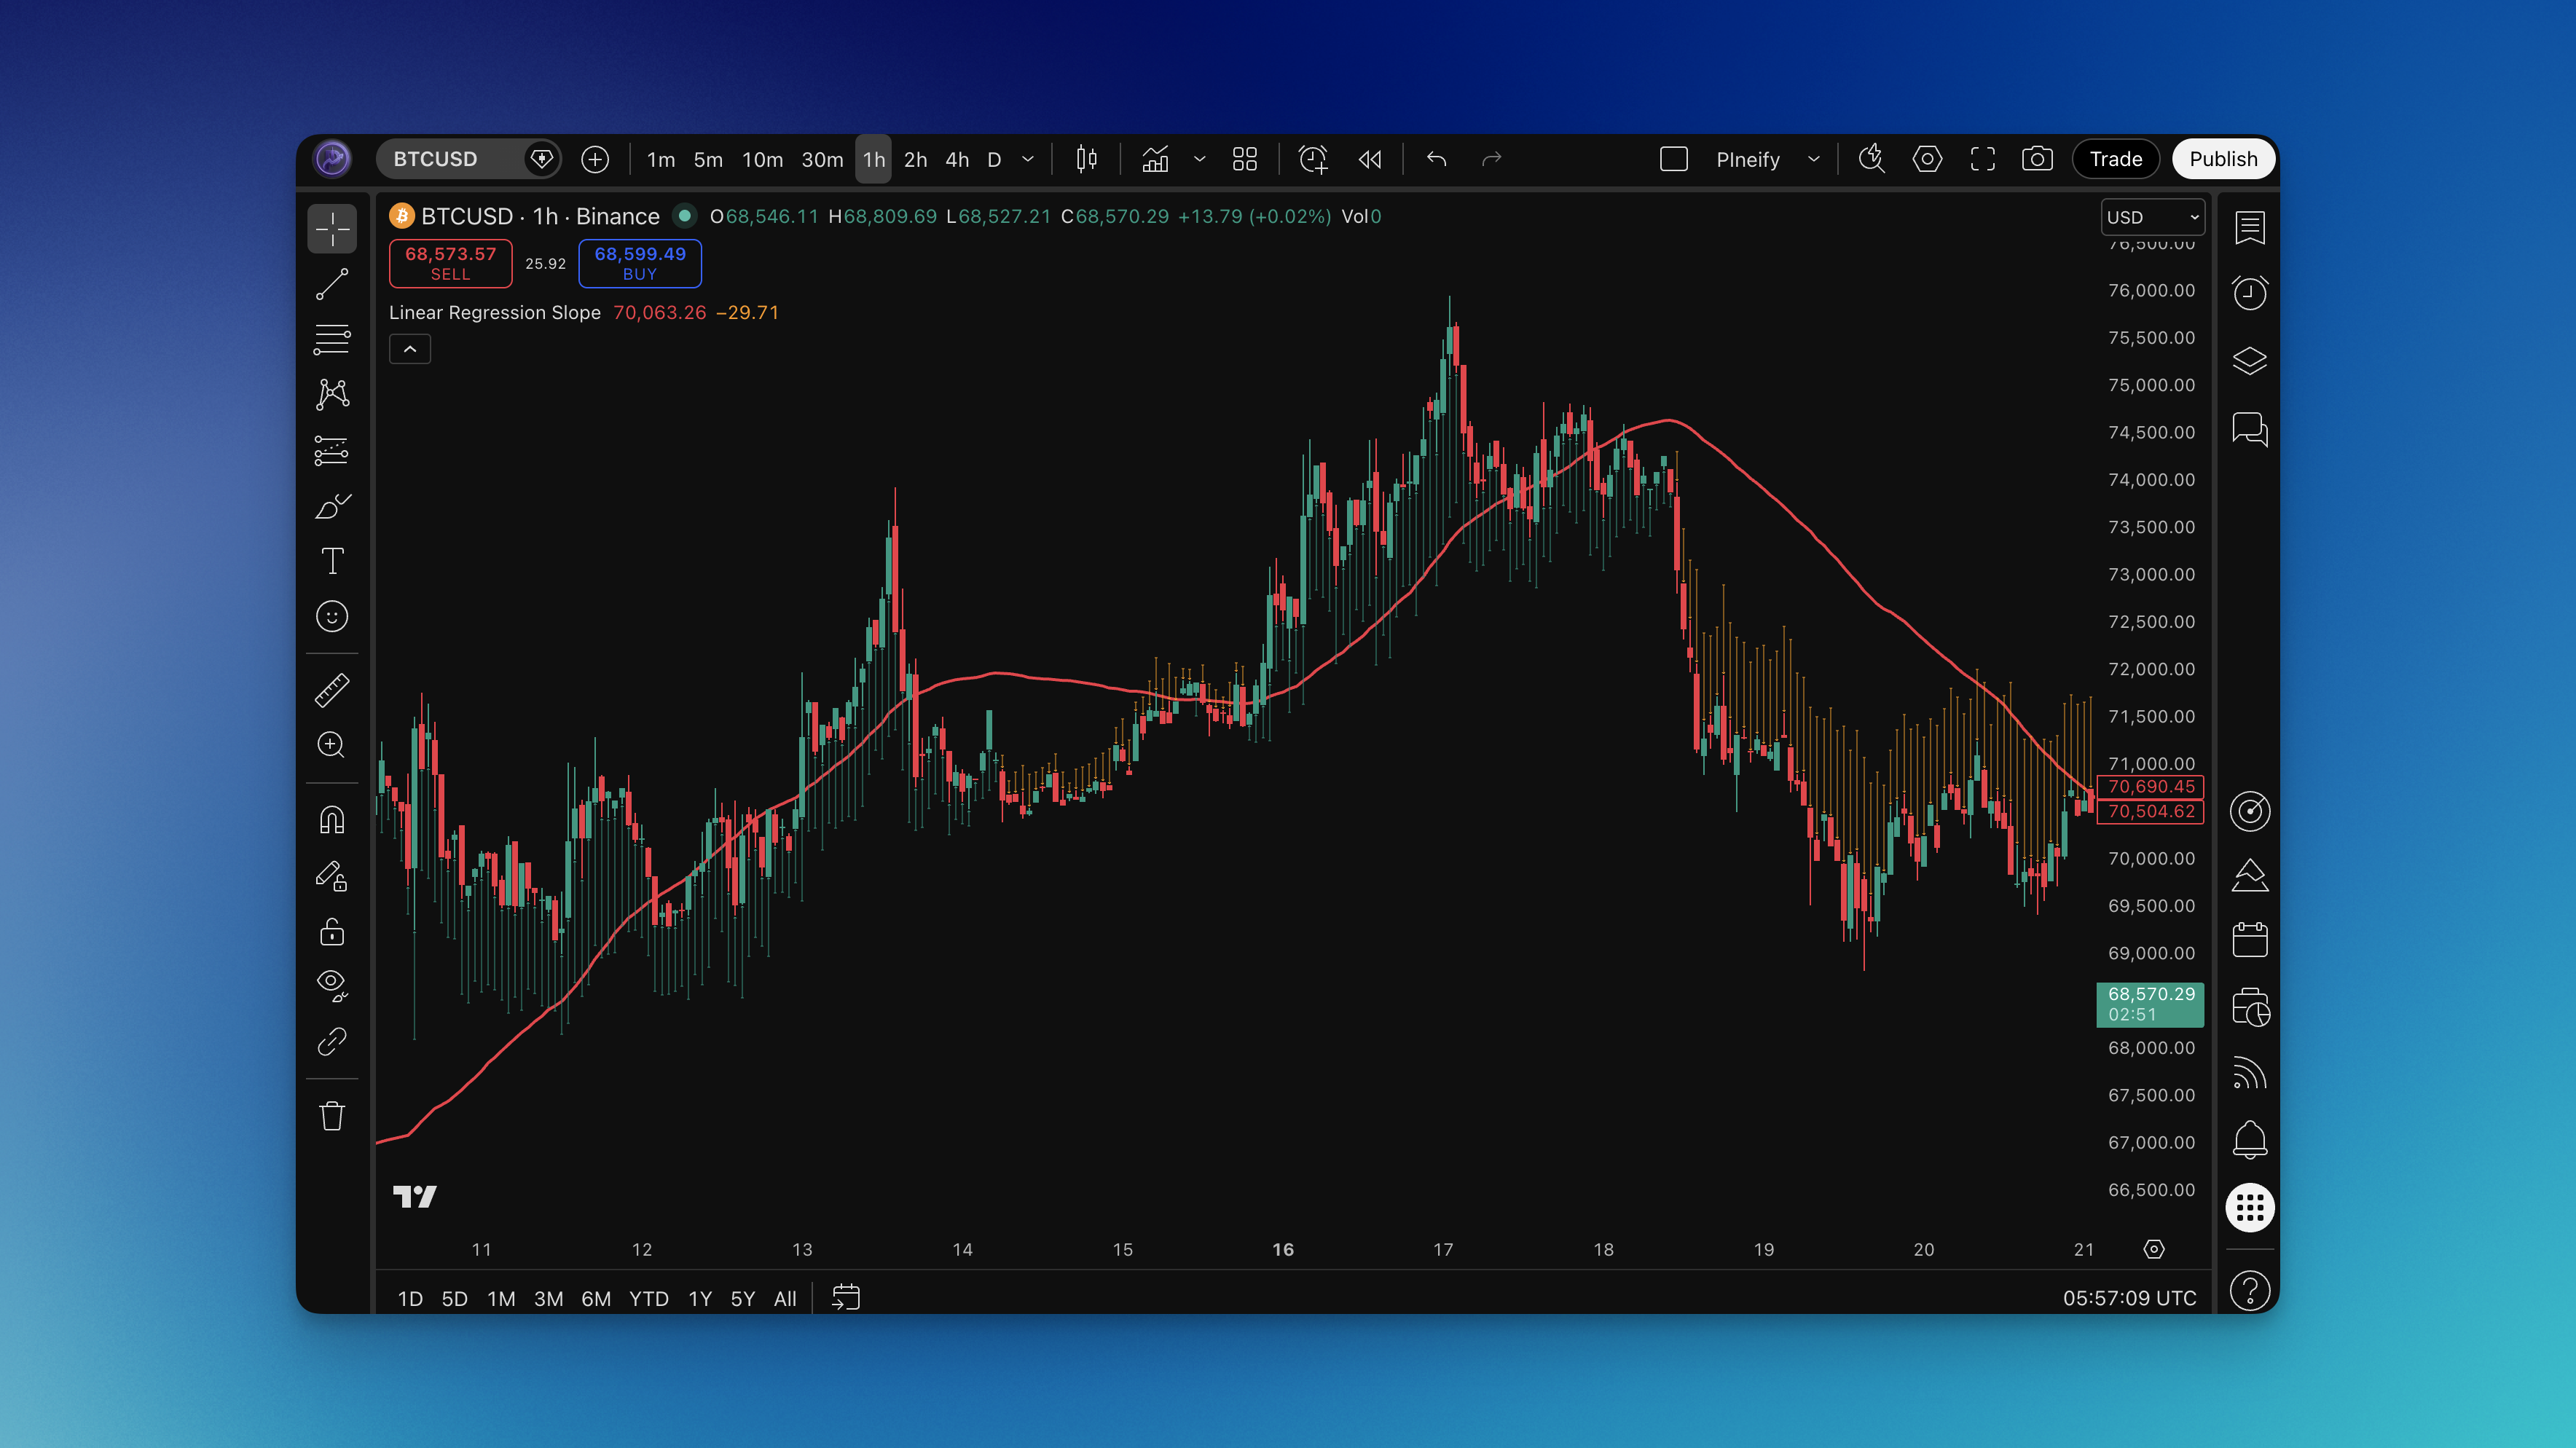
Linear Regression Candles is a statistical trend-smoothing technique that applies linear regression to each OHLC component over a set lookback period. It solved a real problem for me in January 2025 when I was trading BTC/USD and getting chopped up by intraday noise. Instead of plotting raw data, the indicator calculates a regression line for open, high, low, and close values separately, then displays them as smoothed candles that filter noise while preserving trend structure.
What I found most valuable is how these smoothed candles make trend changes visible earlier. When raw candles are still fighting back and forth on the 15-minute chart, the LinReg candles often show a clearer directional bias. Combined with a signal line (SMA or EMA of the close), you get a clean framework for identifying trend direction and potential reversals.
![Is TradingView Down? How to Check Status and Troubleshoot [Keyword: is tradingview down]](https://r2.pineify.app/img/1760853249479799180307)