How to Go to Indicator Settings in TradingView
· 14 min read
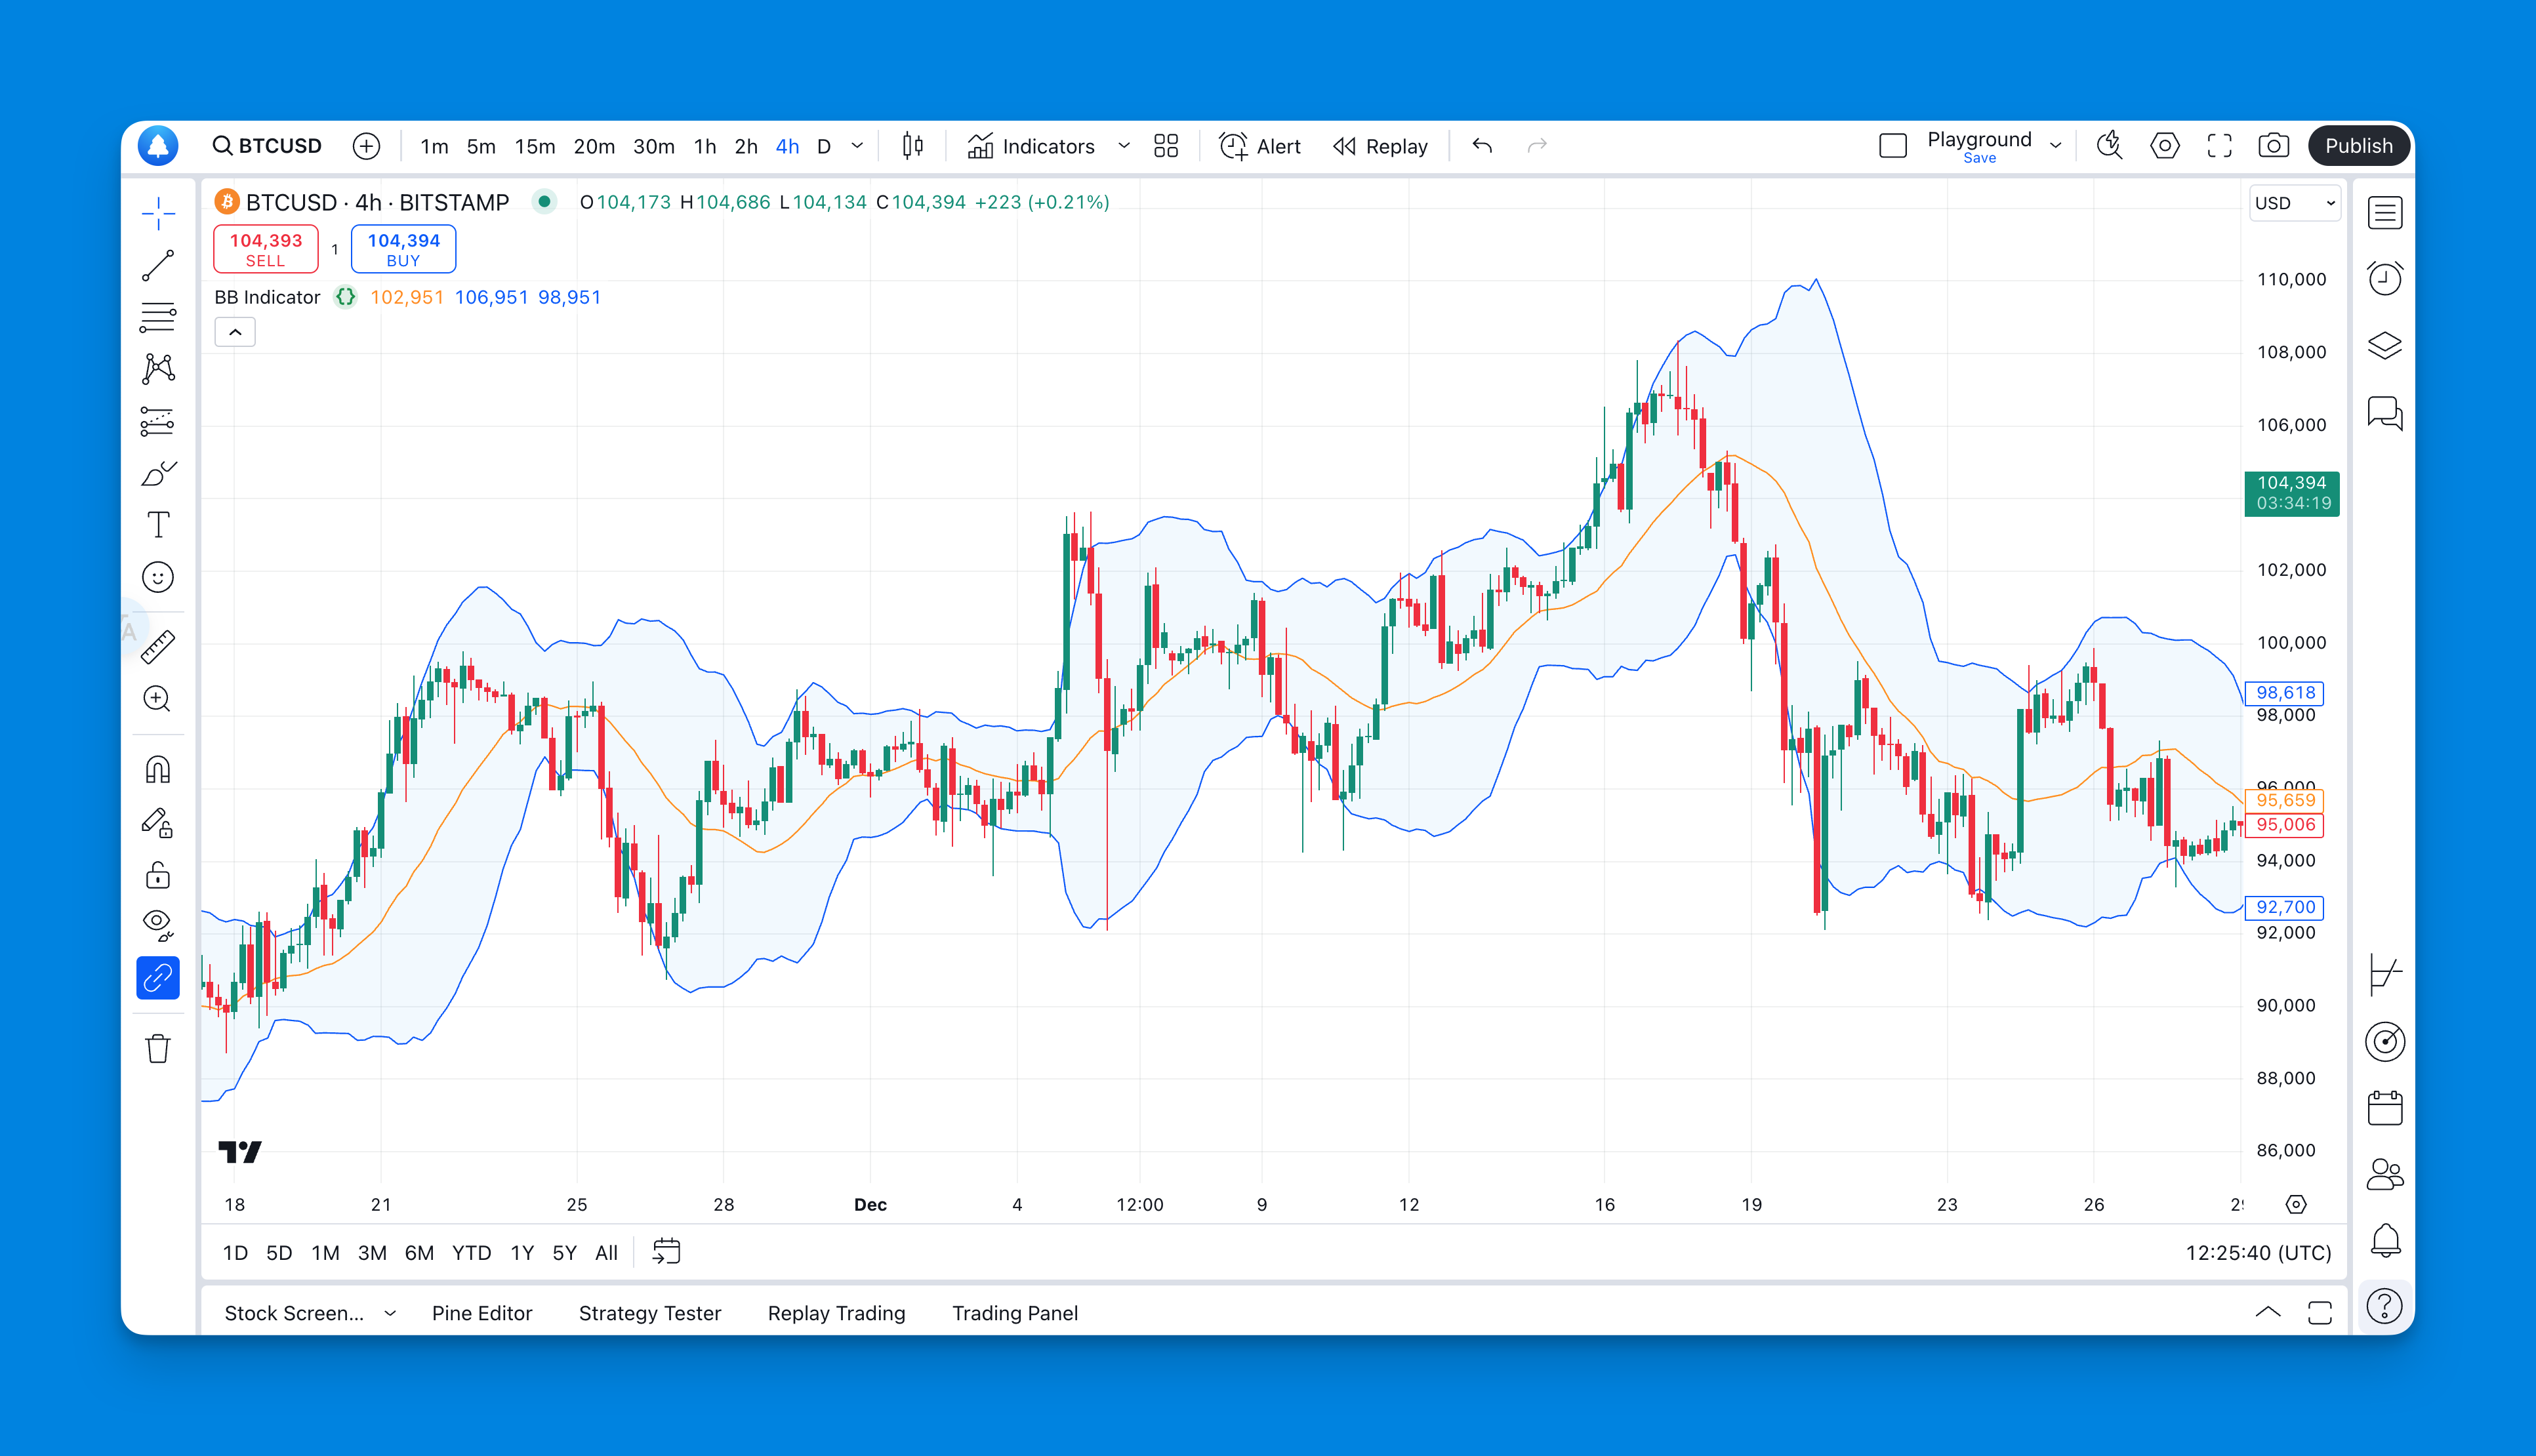
Indicator settings in TradingView are the controls that determine how a technical indicator calculates values and displays on your chart. Every indicator ships with default parameters, but those defaults rarely match your specific market or timeframe. I've been using TradingView for about three years, and the biggest jump in my chart quality came when I stopped accepting the defaults. Here's one example: I trade AAPL on the 1-hour chart, and the default 14-period RSI gave me constant false signals. Changing it to 21 periods cleaned up my entries immediately.