

Chande Forecast Oscillator: formula and TradingView code
The Chande Forecast Oscillator (CFO or FOSC) measures the percentage difference between the current price and a linear regression reference, using the current price as the denominator. The reference matters: a fitted endpoint measures a residual inside the current window; a forecast made on the previous bar measures a one-step forecast error.
Use this page to identify the version, reproduce its values, and copy a Pine Script that exposes the reference in TradingView's Data Window. A positive reading describes price relative to the selected line; it does not establish the next market direction.
Define the regression reference first
For a price P and reference R, the percentage is 100 × (P − R) / P. It equals zero when price matches the reference. With P positive, +1 means price is above the reference by 1% of the actual price. It is not the percentage return from the reference to the actual price, which would use R as denominator.
| Version | Regression window | Reference at bar t |
|---|---|---|
| Current fitted endpoint | N bars ending at t, including Pₜ | Line evaluated at its final fitted observation |
| Previous one-step forecast | N bars ending at t − 1 | Previous line extended one bar to t |
Sierra Chart's CFO definition uses its current linear regression moving average. Its LRMA documentation identifies that value as the right endpoint. Tulip FOSC instead subtracts the previous Time Series Forecast; TSF extends the fitted line to the next bar.
The example defaults to the fitted endpoint and offers the previous-forecast version as an explicit setting. Extending the current line one bar forward and comparing it with today's price would mix different target times. Comparing today's price with today's fitted endpoint is a valid residual calculation, but cannot be presented as a forecast made before that price arrived.
A four-price example you can recalculate
Assume four consecutive closes of 100, 102, 104, and 108, with N = 3. Evaluate both versions at the fourth close. These are invented arithmetic inputs, not market data or a backtest.
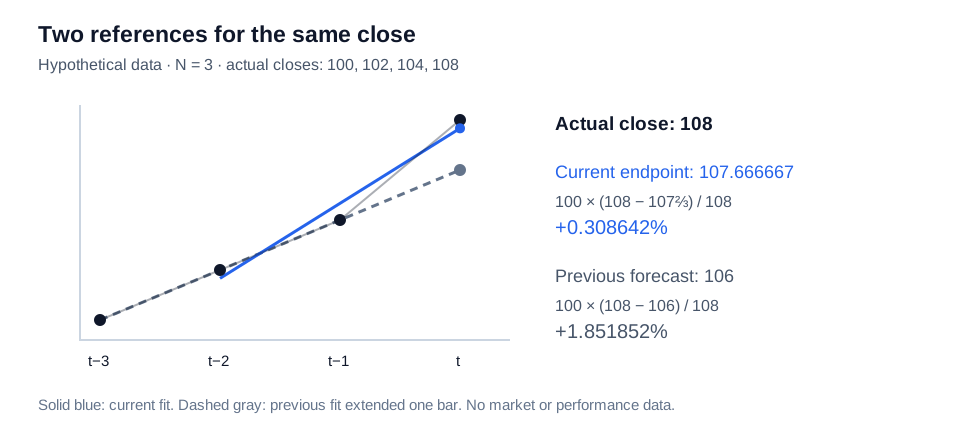
For the current window [102, 104, 108], label the observations x = 0, 1, 2. Their mean is 104⅔ and mean x is 1. Least-squares slope b = Σ[(x − 1)(P − 104⅔)] / Σ[(x − 1)²] = 6 / 2 = 3. The intercept a = 104⅔ − 3 = 101⅔. At x = 2, the fitted endpoint is 107⅔.
| Calculation at close 108 | Reference | Result |
|---|---|---|
| Current endpoint: 100 × (108 − 107⅔) / 108 | 107.666667 | +0.308642% |
| Previous forecast: 100 × (108 − 106) / 108 | 106 | +1.851852% |
The previous window [100, 102, 104] fits a = 100 and b = 2. Extending it to x = 3 gives 106, before observing 108. The current-window fit already includes 108, explaining the smaller residual here. That difference is an arithmetic consequence, not evidence of better forecasting.
Pine Script v6 with both definitions
Paste this indicator into TradingView's Pine Editor and add it to a standard candle chart. The code calculates both regression references on each bar. The difference between offset 0 and offset 1 on the same fitted line gives its slope; adding that slope gives a one-step projection. The history reference [1] retrieves the projection formed on the previous bar.
//@version=6
indicator("Chande Forecast Oscillator: two definitions", shorttitle="CFO audit", overlay=false, precision=6)

length = input.int(14, "Regression length", minval=3, maxval=500)
source = input.source(close, "Source")
mode = input.string("Current fitted endpoint", "Reference", options=["Current fitted endpoint", "Previous one-step forecast"])

endpoint = ta.linreg(source, length, 0)
slope = endpoint - ta.linreg(source, length, 1)
nextForecast = endpoint + slope
previousForecast = nextForecast[1]
validCount = math.sum(na(source) ? 0.0 : 1.0, length)
currentReady = validCount == length
usePrevious = mode == "Previous one-step forecast"
reference = usePrevious ? previousForecast : endpoint
ready = usePrevious ? currentReady[1] : currentReady
// Policy: only positive current prices have the intended percentage interpretation.
fosc = ready and not na(reference) and not na(source) and source > 0 ? 100.0 * (source - reference) / source : na

plot(fosc, "FOSC (%)", color=color.blue, linewidth=2, style=plot.style_linebr)
hline(0, "Zero", color=color.gray)
plot(reference, "Selected reference price", display=display.data_window)
plot(endpoint, "Current fitted endpoint", display=display.data_window)
plot(previousForecast, "Previous one-step forecast", display=display.data_window)

crossUp = ta.crossover(fosc, 0)
crossDown = ta.crossunder(fosc, 0)
alertcondition(crossUp and barstate.isconfirmed, "Closed-bar cross above zero", "FOSC crossed above zero on a closed bar.")
alertcondition(crossDown and barstate.isconfirmed, "Closed-bar cross below zero", "FOSC crossed below zero on a closed bar.")
Select either reference definition in the indicator settings.
The plotted value updates during an open bar. Alert conditions require barstate.isconfirmed, consistent with TradingView's close-confirmation documentation. Create an alert using the selected condition after choosing the intended source, length, and reference mode.
Parameters and boundary conditions
- Length: 14 bars is an editable example, not a recommended optimum. Use 3 for the calculation above. Two points fit exactly, so the endpoint residual collapses to zero; the code requires at least 3.
- Source: close is the default. Changing to another series changes both the regression inputs and the actual value used as denominator. Synthetic candles require their own data interpretation.
- Warm-up: endpoint mode needs N valid observations; previous-forecast mode needs a completed N-bar window one bar earlier. Missing values in the required window produce na.
- Zero price: division by zero is undefined. This code returns na rather than substituting zero or a small arbitrary denominator.
- Negative price: with P = −5 and R = −6, raw arithmetic gives −20% even though P is above R. The code deliberately suppresses values at P ≤ 0. Near-zero positive prices can still produce very large percentages.
- Thresholds: there is no universal overbought or oversold level. A zero cross records a change of side relative to a moving reference; it does not prove a profitable entry.
FOSC versus Rate of Change
ROC compares Pₜ with Pₜ₋ₙ and divides by Pₜ₋ₙ. On the four-price example, ROC(3) is 100 × (108 − 100) / 100 = 8%. Neither FOSC result equals that return. A simple moving average of one-bar price changes also has no regression reference and is a different indicator.
Check values before defining a strategy
- Match chart symbol, candle type, timeframe, session, source, and regression length.
- Choose the reference mode and inspect its price in the Data Window. Confirm whether today's source was included in the fit.
- Recalculate 100 × (source − reference) / source on several closed bars, including a missing-data or nonpositive-price case if the series has one.
- Check zero crosses at bar close. In previous-forecast mode, verify that the reference came from the prior bar rather than the current projection.
- Only then specify entries, exits, position size, commission, and slippage for a separate strategy test. An oscillator calculation alone does not supply those rules.
Turn the definition into a checkable script
Give Pineify's Pine Script AI Coding Agent the reference version, source, length, nonpositive-price policy, and confirmation timing. Ask it to expose intermediate values so you can compare each bar before adding strategy orders.
Build an N = 14 Chande Forecast Oscillator using the previous bar's one-step regression forecast. Divide by the current close, return na when close is nonpositive, expose the reference in the Data Window, and confirm zero-cross alerts at bar close.Open Pine Script AI Coding Agent
Educational calculation and implementation guidance. The example does not establish trading performance or provide an investment recommendation.
Frequently asked questions
Sources and related guides
Implementation references checked October 17, 2026. Provider definitions differ as described above.
- Sierra Chart: Chande Forecast Oscillator formula
- Sierra Chart: linear regression endpoint calculation
- Tulip Indicators: Forecast Oscillator
- Tulip Indicators: Time Series Forecast
- Tulip source: previous-forecast alignment
- TradingView: bar states and close confirmation
Continue with TradingView indicators, the Rate of Change formula, or the Chande Momentum Oscillator, which uses gains and losses rather than a regression residual.