

Elder Force Index on TradingView: Formula and Limits
The Force Index indicator multiplies each close-to-close price change by that bar's volume. Elder Force Index (EFI) usually smooths this raw series with an exponential moving average. TradingView defaults to 13 bars. Use the raw value to inspect a single bar and the EMA to inspect its weighted history.
Raw force = (close − previous close) × volume
EFI(N) = EMA(raw force, N)
EFI(1) = raw force
A positive smoothed EFI does not require the latest close to rise. The calculation below shows why. Alexander Elder introduced the indicator in his 1993 book Trading for a Living, as documented by TradingView.
A six-bar calculation you can check
These are hypothetical closes and volume units, not market data or a backtest. A is the start of the dataset, so it has no previous close. Seed the EMA with the first available raw force at B. For N = 13, alpha = 2 / (13 + 1) = 1 / 7. Each later value is raw force / 7 + previous EMA × 6 / 7. Calculations retain full precision; the table rounds to two decimals.
| Bar | Close | Volume | Close change | Raw / EFI(1) | EFI(13) |
|---|---|---|---|---|---|
| A | 100.00 | 100 | Unavailable | Unavailable | Unavailable |
| B | 101.00 | 200 | +1.00 | +200.00 | +200.00 (seed) |
| C | 100.50 | 300 | -0.50 | -150.00 | +150.00 |
| D | 100.50 | 400 | 0.00 | 0.00 | +128.57 |
| E | 99.50 | 1,000 | -1.00 | -1,000.00 | -32.65 |
| F | 100.00 | 200 | +0.50 | +100.00 | -13.70 |
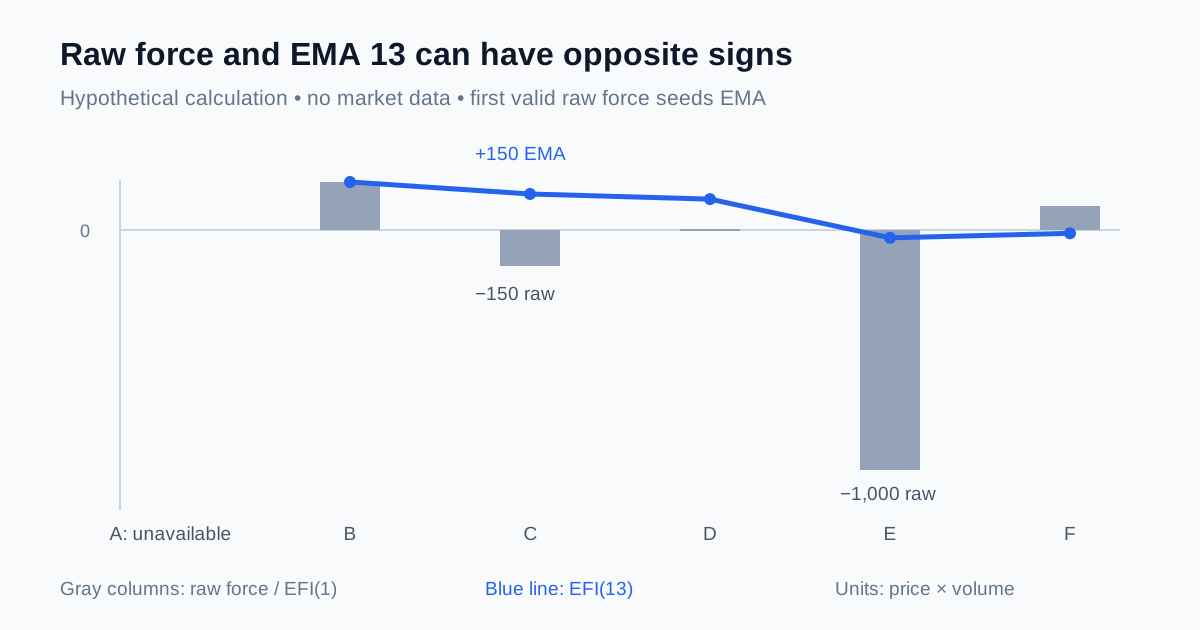
At C, (-150 + 6 × 200) / 7 = 150: a down close leaves EFI positive. At D, an unchanged close gives zero raw force despite 400 volume units, while the EMA decays. At F, the up close produces +100 raw force but the previous negative EMA keeps EFI below zero. The two series can disagree without a calculation error.
Initial history matters. Seeding B with zero instead of its raw force would produce 28.57 at B, changing every later value. Compare implementations with the same loaded history and initialization policy; a 13-period EMA is a recursive average, not a window that discards everything older than 13 bars.
Copy the Pine Script v6 indicator
Paste the complete source into Pine Editor and add it to a standard candlestick chart. The blue line is EFI; optional gray columns show raw force. The script uses the current chart's close and volume and has no orders or automatic divergence detection.
// This source code is subject to the Mozilla Public License 2.0.
// https://mozilla.org/MPL/2.0/
// © Pineify
//@version=6
indicator("Elder Force Index: raw and EMA", overlay=false)

length = input.int(13, "EMA length", minval=1)
showRaw = input.bool(false, "Show raw force")

// Strict data policy: missing volume is not zero volume.
if na(volume)
    runtime.error("Volume is missing on this feed. Select a feed with volume.")
var float totalVolume = 0.0
totalVolume += nz(volume)
if barstate.islast and totalVolume == 0
    runtime.error("No nonzero volume is available in this dataset.")

rawForce = (close - close[1]) * volume
smoothedForce = ta.ema(rawForce, length)
efi = length == 1 ? rawForce : smoothedForce

plot(efi, "EFI", color=color.blue, linewidth=2)
plot(showRaw ? rawForce : na, "Raw force", color=color.new(color.gray, 40), style=plot.style_columns)
hline(0, "Zero", color=color.gray)

crossUp = ta.crossover(efi, 0)
crossDown = ta.crossunder(efi, 0)
alertcondition(crossUp and barstate.isconfirmed, "EFI above zero at close", "EFI crossed above zero on a closed bar.")
alertcondition(crossDown and barstate.isconfirmed, "EFI below zero at close", "EFI crossed below zero on a closed bar.")
The first raw value is unavailable because close[1] does not exist at the dataset's first bar. The EMA starts when a valid raw value is available. Missing volume stops this example instead of being replaced with zero. An isolated reported zero is allowed; an entirely zero-volume dataset is rejected.
The plotted value updates while a bar is open. The two alert conditions require barstate.isconfirmed. Create the alert in TradingView and select Once Per Bar Close. This confirms the bar's calculation; it does not establish that the following price move will agree with the signal.
| Input | Default | Effect |
|---|---|---|
| EMA length | 13, minimum 1 | 1 exposes raw force. Higher values give each new bar less weight. |
| Show raw force | Off | Adds columns for auditing; a large spike can compress the visible EMA scale. |
Separate trend confirmation from a pullback trigger
A filter decides which conditions qualify for further review. A trigger identifies a particular bar. Keeping those roles separate makes the rules testable. The examples here are candidate research rules, with no claimed trading performance.
Trend filter
Require EFI(13) > 0 on a closed bar for a positive-force filter. Add a separately specified price-trend rule if needed. This condition can remain true across many bars and is not itself a fresh entry event.
Pullback trigger
One testable long-side candidate is EFI(13) > 0 while raw force crosses from at or below zero to above zero at the close. It asks whether a short negative contribution has ended inside a positive smoothed regime. It can repeatedly trigger in a range, and a pullback may become a full reversal.
Divergence review
Choose raw or smoothed force before comparing swings. Pair EFI values at two defined price-pivot bars. A lower price low with a higher EFI reading is a bullish divergence. With three right-hand bars required, the second pivot is only known three bars later. A zero cross after that is an additional event, not proof of a reversal.
Before testing trades, define exits, position size, fill timing, commission and slippage. This page provides indicator calculations and research examples, not investment advice or a validated strategy.
Volume units, missing data and unusual bars
EFI has units of price change multiplied by the feed's volume unit. It is not a percentage or a direct cash-flow total. Stock volume can be shares, futures volume contracts and crypto volume base-asset units; check the specific provider rather than assuming every chart reports the same quantity.
- Scale: doubling every volume value doubles raw force and the identically seeded EMA. Converting volume to thousands divides both by 1,000. Zero-cross timing is unchanged by a constant positive scale factor, but fixed numeric thresholds must change.
- Missing versus zero: no available volume is na in Pine. A reported zero gives zero raw force when closes exist. Do not quietly substitute one for the other. This example deliberately stops on any missing volume in the loaded history.
- A volume outlier: check the source bar before removing it. A genuine news bar belongs in the original formula. Capping volume creates a modified indicator. With EMA 13, an added raw-force shock of 700 adds 100 to that bar's EMA and about 85.71 to the next, if every later input is unchanged.
- Feed and session changes: keep the exchange, contract, adjustment and session choices fixed during comparison. A broker's tick-count feed is not equivalent to exchange trade volume. Contract rolls and price adjustments can alter close-to-close changes.
- Chart type: synthetic closes on Heikin Ashi or Renko charts change the input. Audit on standard candles first. Open-bar close and accumulated volume can both change until the bar ends.
TradingView's chart-information documentation describes volume units, unavailable values and synthetic prices. The scaling and outlier examples are direct calculations from this page's formula.
Turn the calculation into an explicit script request
Use Pineify's Pine Script AI Coding Agent to adapt the inputs and confirmation rules. Give it a specification that can be checked against the table, then review the generated source on the intended TradingView feed.
- Open the Pine Script AI Coding Agent and supply the source on this page.
- Specify close-to-close change, the feed's volume unit and the EMA length.
- State whether missing volume should stop execution, and require alerts only at bar close.
- Compare raw force and EMA values bar by bar before adding pivot or trend rules.
- Define strategy exits, costs and fills separately if converting the indicator into a backtest.
Force Index questions
Sources and related indicators
Official references checked October 17, 2026.
- TradingView: Elder's Force Index formula and default length
- TradingView: prices, volume and chart information
- TradingView: bar states and close confirmation
On-Balance Volume
Compare signed cumulative volume with price-change-weighted force.
Volume-Weighted Moving Average
Compare a volume-weighted price average with the EFI oscillator.