

Double Exponential Moving Average (DEMA) on TradingView
DEMA uses two EMA stages and subtracts the second from twice the first. The correction reduces smoothing delay, but can push the line beyond recent prices. Use the formula, worked table and Pine Script below to check what the DEMA indicator actually plots before adding crossover rules.
E1 = EMA(source, N)
E2 = EMA(E1, N)
DEMA = 2 × E1 − E2
Both stages use the same length. E2 alone is a twice-smoothed EMA; the subtraction is what makes DEMA different. TradingView attributes the indicator to Patrick Mulloy in 1994.
One turn, three different outputs
This is a hypothetical calculation, not a market backtest. Set N = 3, so alpha = 2/(N+1) = 0.5. At bar 0, explicitly seed E1 and E2 at 100. Each later row uses E1 = 0.5 × price + 0.5 × previous E1, then E2 = 0.5 × current E1 + 0.5 × previous E2.
| Bar | Price | EMA (E1) | Twice-smoothed (E2) | DEMA |
|---|---|---|---|---|
| 0 (seed) | 100 | 100 | 100 | 100 |
| 1 (rise) | 104 | 102 | 101 | 103 |
| 2 (rise) | 108 | 105 | 103 | 107 |
| 3 (flat) | 108 | 106.50 | 104.75 | 108.25 |
| 4 (flat) | 108 | 107.25 | 106 | 108.50 |
| 5 (fall) | 100 | 103.625 | 104.8125 | 102.4375 |
| 6 (flat) | 100 | 101.8125 | 103.3125 | 100.3125 |
At bar 2, DEMA is 107, one point below price; EMA is 105, three points below. At bar 4, price is still 108, but DEMA reaches 108.50. That is overshoot. At the fall on bar 5, DEMA moves to 102.4375 while EMA is 103.625. These are responses to this exact path, not a universal lead measured in bars.
Price can cross below DEMA without falling: bar 2 has price above DEMA, while bar 3 has the same price below DEMA. A crossover by itself does not establish a price reversal.
Pine Script: inspect both EMA stages
Paste this example into the Pine Editor, save it and add it to your chart. The code calculates both stages on every bar and plots their DEMA combination. It is an indicator with no orders or alerts.
// This source code is subject to the terms of the Mozilla Public License 2.0 at https://mozilla.org/MPL/2.0/
// © Pineify

//@version=6
indicator(title="Double Exponential Moving Average", overlay=true, max_labels_count=500)

// Inputs
length = input.int(9, "Length", minval=1)
src = input.source(close, "Source")

// DEMA Calculation
e1 = ta.ema(src, length)
e2 = ta.ema(e1, length)
dema = 2 * e1 - e2

// Plot
plot(dema, "DEMA", color.rgb(41, 98, 255, 0), 2)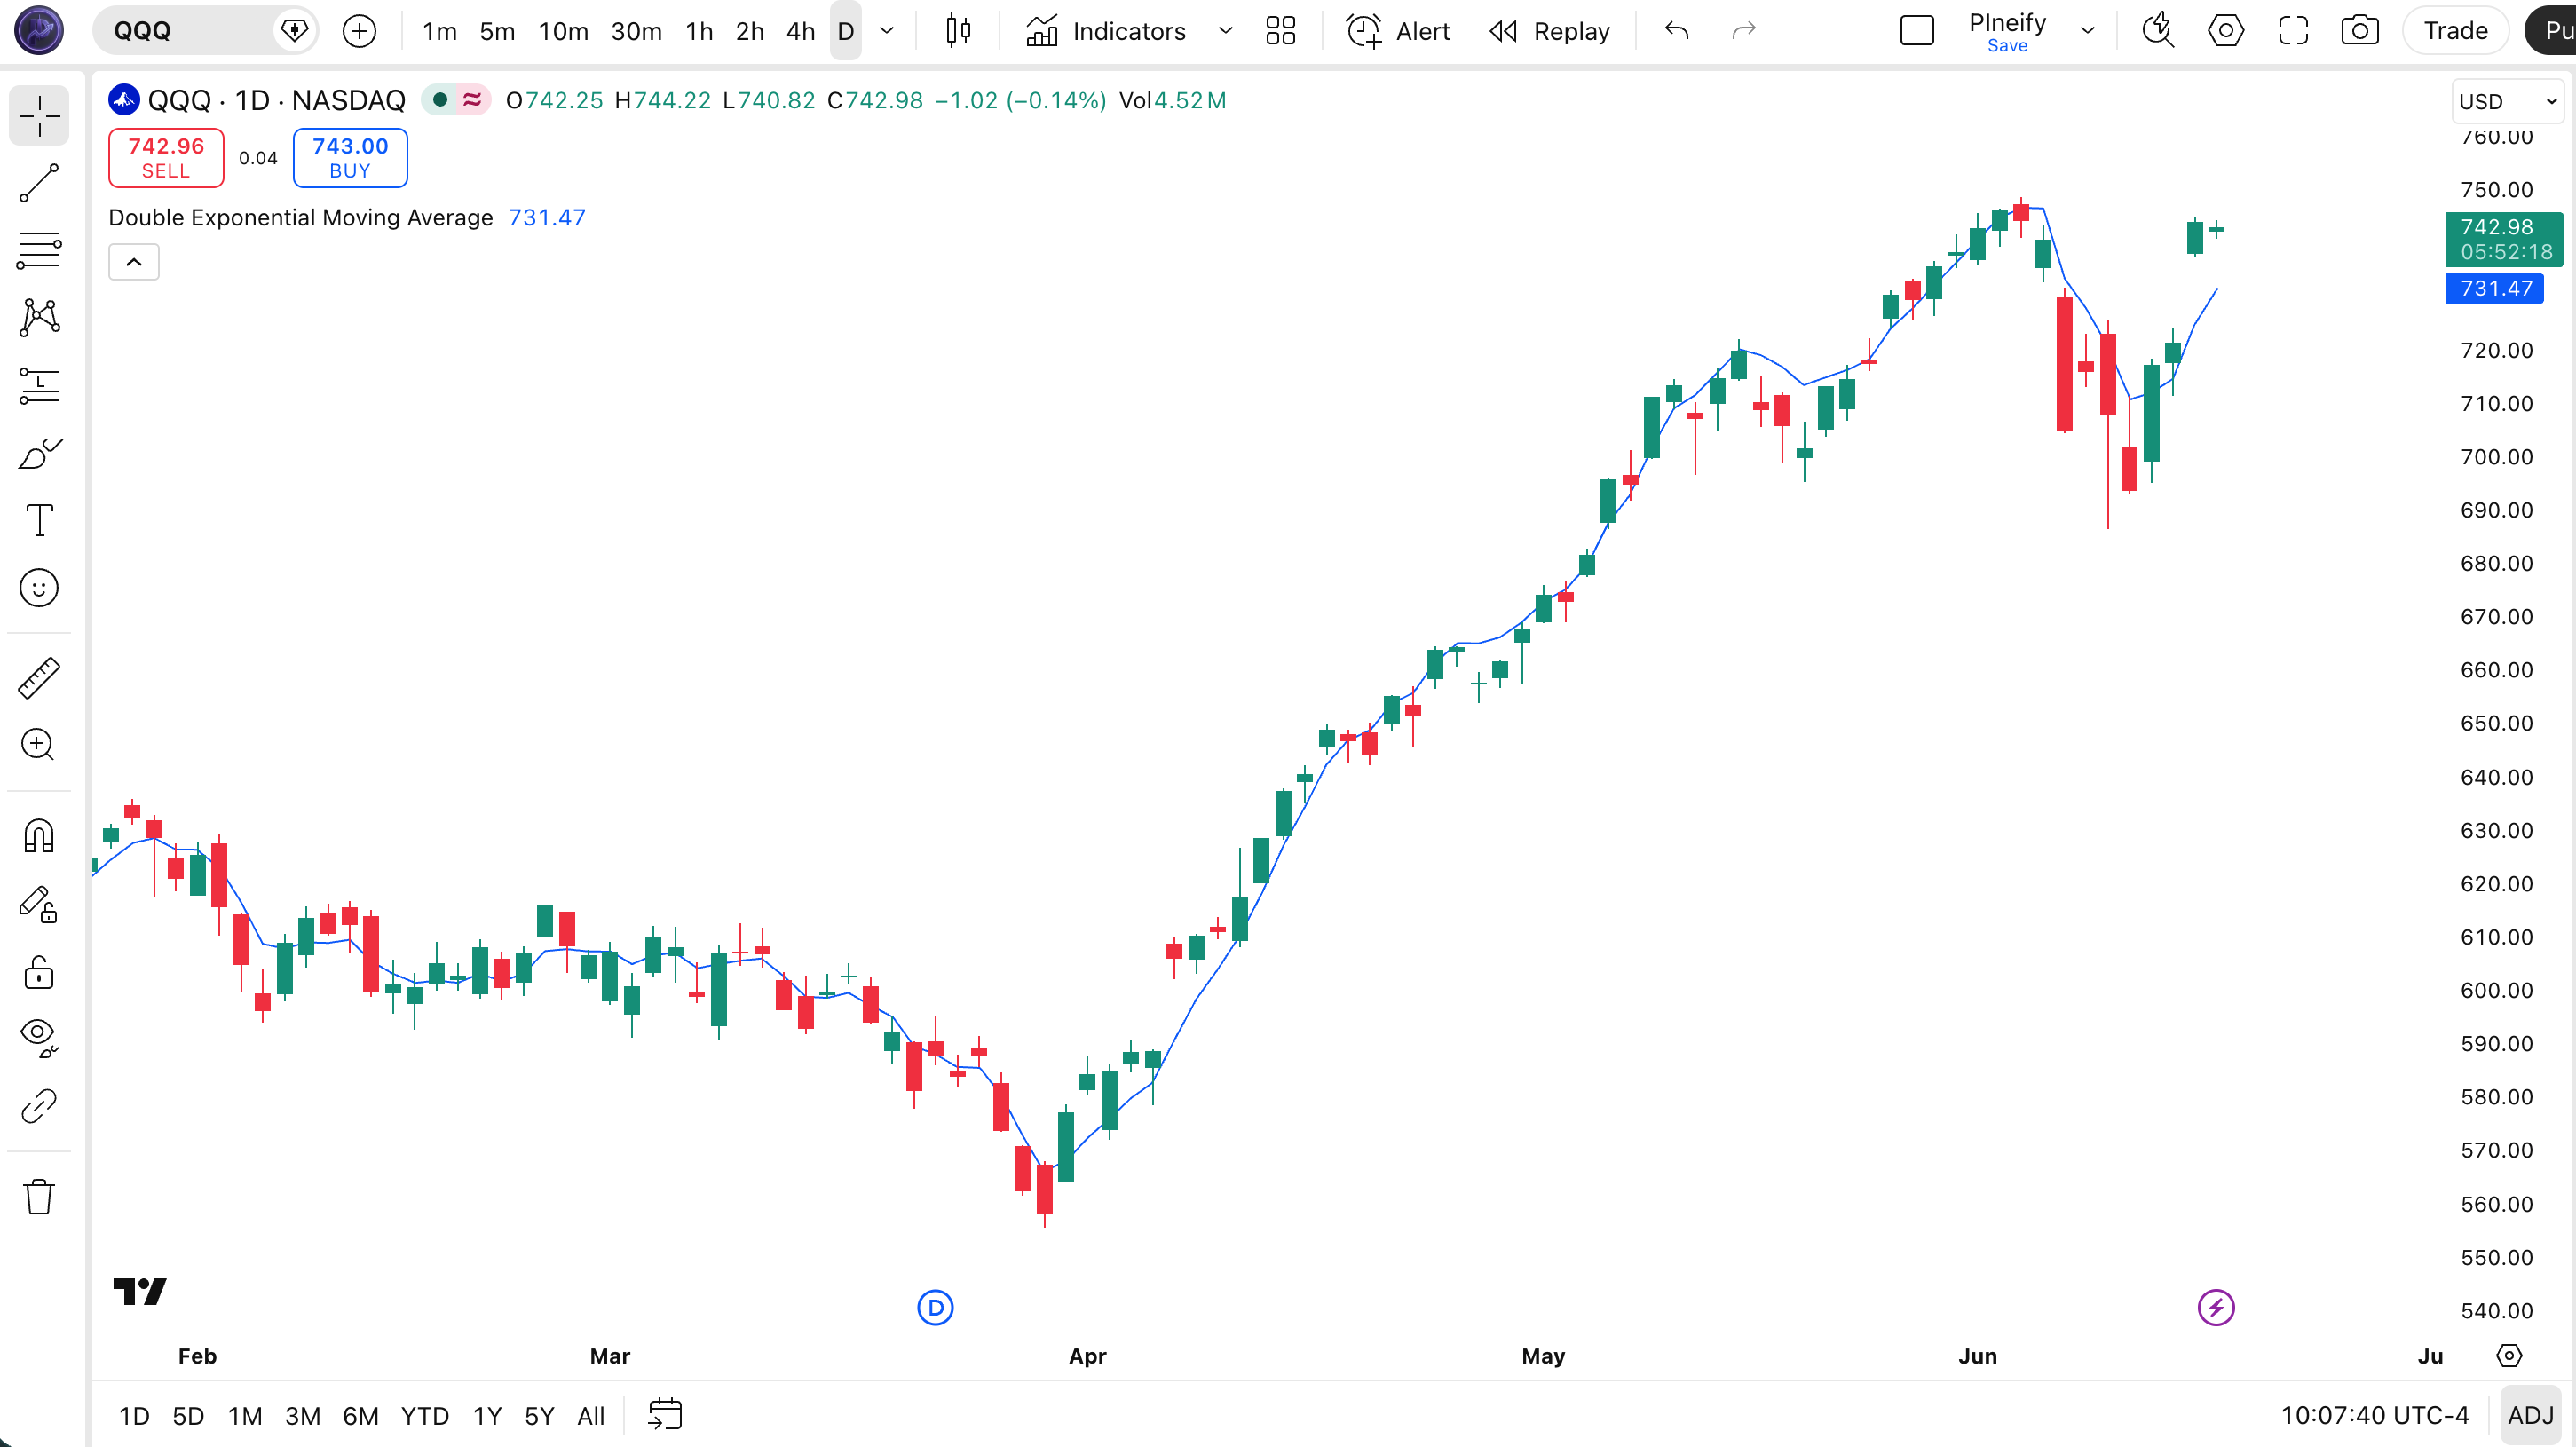
| Input | Example default | What to check |
|---|---|---|
| Length | 9 bars | Integer at least 1; shared by both EMA stages. |
| Source | close | Use the same source for every comparison. |
The example length is a starting input, not an optimized setting. At length 1, both EMA stages equal the source and DEMA also equals the source. Increasing length changes the recursive response; it does not set a hard cutoff for all earlier observations.
Initialization and failure boundaries
- Match history before comparing values. Each stage depends on a previous EMA. Different seeds or loaded history can produce early differences. The table assumes two starting values of 100; it does not specify TradingView's seed for every dataset. Inspect E1 and E2 separately and allow additional history until differences fall within your stated tolerance.
- Keep the input context fixed. Symbol, exchange feed, timeframe, session and price source are part of the calculation. A 9-bar DEMA on an hourly chart and a 9-bar daily DEMA consume different series. Matching the number 9 is insufficient.
- Separate live values from closed-bar decisions. With close as the source, both stages update while a realtime bar is open. A crossing can disappear before the close. Specify whether a condition must wait for bar confirmation; the supplied plot does not impose that condition.
- Inspect flat and alternating prices. The correction can overshoot after a move, and alternating prices can repeatedly cross the line. A faster response alone does not establish better entries, lower drawdown or a profitable rule.
- Define trading mechanics separately. This calculation has no exit, stop, position size, commission or slippage model. If converted to a strategy, state those assumptions and validate results on data outside the parameter-selection sample.
Educational indicator analysis, not investment advice or a return forecast.
Turn the calculation into a checkable script
Ask Pineify's Pine Script AI Coding Agent to expose E1, E2 and DEMA for bar-by-bar comparison. Include your length, source, chart timeframe and confirmation rule in the request.
- State the formula and require the same length in both EMA stages.
- Request separate values for the two intermediate stages and the final line.
- Check a price turn, a flat interval and the earliest available bars against the chart.
- Define confirmed-bar conditions before adding alerts.
- Add exits, sizing and costs only when moving from the indicator to a strategy.
DEMA questions
DEMA combines two EMA stages as 2 × EMA(source, N) − EMA(EMA(source, N), N). The subtraction compensates for some smoothing delay. It can exceed the source range, so it is not a conventional weighted average with only positive weights.
No. Smoothing twice gives E2 = EMA(E1, N). DEMA is 2 × E1 − E2. In the demonstration, bar 2 has E1 = 105 and E2 = 103, giving DEMA = 107. Plotting E2 alone would show 103 and a different response.
Paste the Pine Script example into the Pine Editor, save it and add it to the chart. It plots one DEMA line. Compare it with an EMA using the same length, price source, symbol and chart timeframe. The example has no order or alert logic.
There is no best length established by this page. The code starts at 9 bars and close; the calculation table uses 3 bars to make the arithmetic easy to check. Change one input at a time and evaluate both turns and flat-price intervals before choosing a setting.
The correction E1 − E2 can remain positive after price stops rising. In the example, price stays at 108 while DEMA reaches 108.50. This overshoot follows from the formula; it does not require a new high in price or prove that another rise will follow.
A crossover only describes the relationship between price and the computed line. Overshoot can even place DEMA above an unchanged price. A trading rule must separately define whether the bar must close, when an order executes, exits, position sizing and costs. This indicator does not supply those rules.
Each EMA stage carries a previous value. Different seeds, available history or missing-value treatment can change the early output. Match the source and history first, inspect both intermediate EMA values, and compare later bars. Do not assume exactly N bars removes all initialization differences.
With close as its source, DEMA updates as the current price changes before the bar closes. A temporary crossing can disappear. Requiring a confirmed bar changes the observation time, but does not prevent differences caused by revised source data or a different history start.
Sources and related indicators
Official documentation checked October 17, 2026. The numerical comparison is an original demonstration.