

Candlestick patterns cheat sheet for TradingView
A candlestick patterns cheat sheet pairs candle shapes with the trend that gives them meaning. This reference covers eight common formations, with printable PDF and SVG downloads and links to their full tutorials. Read the shape first, check the prior trend, then apply a stated confirmation rule. A pattern name alone does not establish a trade or a success rate.
Open the printable PDFDownload, print and read the sheet
Open the original one-page PDF above, or download the PDF and SVG under Related Resources. Both formats contain the same eight schematic candle diagrams with trend, confirmation and invalidation notes. The diagrams are illustrative, not historical prices. The candlestick patterns PDF uses A4 portrait; select fit to page when printing on a different paper size. Each blue pattern title links to its tutorial.
- The body joins open and close; a wick extends to the high or low. Read OHLC values rather than relying on color alone.
- Green means close above open and red means close below open in this sheet. TradingView colors are configurable, including an option based on the previous close.
- All confirmation and invalidation rules below are illustrative choices for testing. They are separate from the shape definitions and do not establish an edge.
Single-candle reference: context changes the meaning
A hammer and hanging man share a lower-shadow shape but occur after different trends. A shooting star has its long shadow above the body. A doji records a near-equal open and close; it supplies no direction on its own. Each named tutorial is linked under Related Resources and from its diagram title in the SVG.
| Pattern | Shape and prior trend | Illustrative confirmation | Illustrative invalidation |
|---|---|---|---|
| Hammer | Small body near the high, long lower wick; after a decline. | Next close above the hammer high. | Close below the hammer low. |
| Hanging man | Hammer-like shape; after an advance. | Next close below its low. | Close above its high. |
| Shooting star | Small body near the low, long upper wick; after an advance. | Next close below its low. | Close above its high. |
| Doji | Open and close nearly equal; interpret against the preceding trend or range. | After a decline, next close above its high; after an advance, next close below its low. | Close beyond the opposite edge. No breakout means no confirmed setup. |
Two- and three-candle reference
An engulfing pattern concerns the two real bodies; the second candle need not engulf the first candle's wicks. Morning and evening stars need three completed candles. The traditional star definitions include a body gap into the small middle candle. If a detector removes that gap requirement, label it as a modified rule rather than assuming it matches the traditional pattern.
| Pattern | Shape and prior trend | Illustrative confirmation | Illustrative invalidation |
|---|---|---|---|
| Bullish engulfing | After a decline: down body, then an up body covering it. | Next close above the two-candle high. | Close below the two-candle low. |
| Bearish engulfing | After an advance: up body, then a down body covering it. | Next close below the two-candle low. | Close above the two-candle high. |
| Morning star | After a decline: long down body, small body gapped lower, then an up close above the first body midpoint. | Third close completes the pattern; this sheet additionally requires the next close above the three-candle high. | Close below the three-candle low. |
| Evening star | After an advance: long up body, small body gapped higher, then a down close below the first body midpoint. | Third close completes the pattern; this sheet additionally requires the next close below the three-candle low. | Close above the three-candle high. |
Use completed, ordinary candles on TradingView
In Supercharts, select Candles from the chart-type menu. TradingView also provides built-in pattern indicators under Indicators, metrics, and strategies, then Technicals, Patterns and Candlestick patterns. Their settings matter: for example, Bullish Engulfing offers SMA50, SMA50 with SMA200, or no trend detection. Two detectors can disagree because their trend filters differ.
- A candle still forming can change its high, low, close and pattern label. Checking a completed candle avoids that particular intrabar uncertainty, at the cost of waiting for its close.
- Heikin-Ashi OHLC values are synthetic averages. A shape on those candles is not the same test as a pattern on ordinary market OHLC data.
- Record symbol, exchange, timeframe, session, trend filter and gap rule when comparing labels. A daily chart and an intraday chart describe different bars.
- The pattern high/low rule here is a close-based research rule. It is not a guaranteed stop fill; gaps, spread and slippage can change actual execution.
A hypothetical hammer: shape, confirmation, failure
Assume a preceding decline and a completed candle with open 100, high 102, low 94 and close 101. Its body is 1, lower wick is 6 and upper wick is 1. Suppose your written detector accepts that shape as a hammer. A next close at 103 passes this sheet's confirmation rule because it is above 102; a next high at 103 with a close at 101 does not. Under the same illustrative rules, a later close below 94 invalidates the bullish setup. These numbers describe a hypothetical sequence, not a backtest or a recommendation.
- Fix the small-body and wick thresholds before reviewing outcomes. Near-zero bodies require an explicit doji rule.
- This sheet expires an unconfirmed setup after the next candle. Allowing several candles to confirm is a different rule and should be tested separately.
- Define exits, position size, costs and treatment of gaps before assessing results. Counting successful shapes is not the same as measuring a trading strategy.
Turn one row into an editable pattern specification
Choose one formation and write down its numeric definition before asking for a script. An illustrative hammer brief might specify a positive body no larger than 30% of the range, a lower wick at least twice the body, an upper wick no larger than 10% of the range, a close below the 50-period SMA, and detection only after the candle closes. Those thresholds are a separate example specification; the hypothetical candle above would fail its 10% upper-wick cutoff. Keep shape detection separate from the next-candle confirmation rule.
- State whether equality counts at each boundary, which trend filter applies, and whether the rule uses ordinary chart data.
- Ask for visible labels for the pattern and confirmation on their actual detection bars; do not shift a later confirmation backward onto the pattern bar.
- Review generated conditions, compile in TradingView and compare accepted and rejected examples before configuring alerts.
Where Pineify fits
Pineify AI Coding Agent can create and revise Pine Script from a written pattern specification. Use the linked candlestick scripting tutorial to turn one row into editable conditions. This reference page does not scan symbols, execute orders or prove that a pattern is profitable. Generated code still needs review and testing in TradingView.
Related Resources
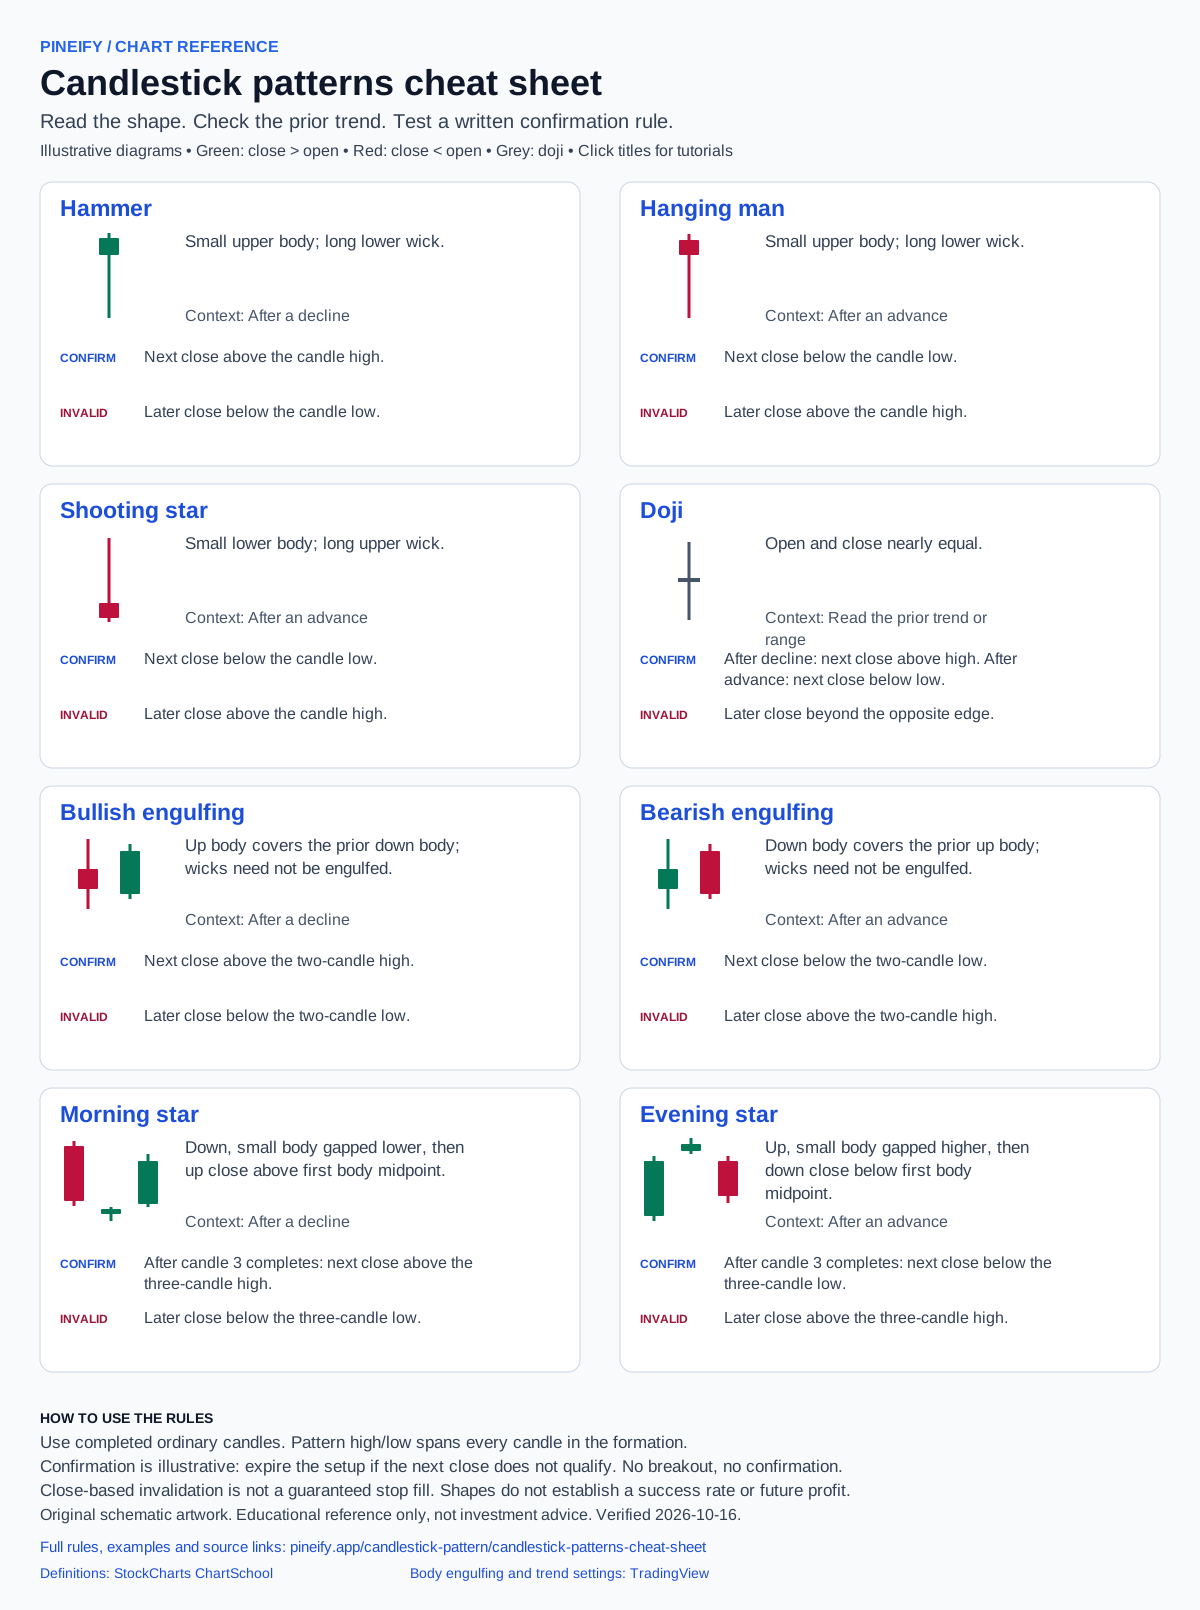
Educational reference only, not investment advice. Diagrams and numeric examples are illustrative. Confirmation and invalidation rules are examples to test, not proven trading rules. Trading involves risk of loss; a pattern, script or historical test does not guarantee future results.
Sources and verification
- StockCharts ChartSchool: bullish reversal definitions and confirmation
- StockCharts ChartSchool: bearish reversal definitions and confirmation
- TradingView: candlestick charts, colors and pattern indicators
- TradingView: bullish engulfing definition and trend settings
- StockCharts ChartSchool: candlestick pattern dictionary
- TradingView Pine Script: repainting and unconfirmed bars
- TradingView Pine Script: synthetic chart data