Moving Average Channel: Spot Breakouts and Trends Early
The Moving Average Channel is a volatility-adaptive envelope indicator that draws upper and lower boundaries around a centerline moving average. It shows you the normal trading range for any asset and flags when price exits that range with momentum. I've been running this on ES futures 15-minute charts since March 2025, and the channel width contraction before the April 4 sell-off was impossible to miss.
How the Moving Average Channel Works
A standard moving average draws one line. The channel draws three: a centerline (your chosen MA) plus upper and lower bands at a set distance. Unlike fixed-percentage envelopes, a dynamic channel shrinks during low volatility and expands when the market gets active.
You get eight moving average types:
- Simple Moving Average (SMA) - flat and slow, solid for daily charts
- Exponential Moving Average (EMA) - reacts faster to recent price action
- Weighted Moving Average (WMA) - heavier weight on the latest bars
- Running Moving Average (RMA) - smooths aggressively, less whipsaw
- Volume Weighted Moving Average (VWMA) - factors in trading volume
- Hull Moving Average (HMA) - low lag, tracks turns closely
- Arnaud Legoux Moving Average (ALMA) - Gaussian filter reduces noise
- Symmetrically Weighted Moving Average (SWMA) - symmetric weight distribution
The channel formula is straightforward:
- Upper = MA + (multiplier x ATR or percentage offset)
- Lower = MA - (multiplier x ATR or percentage offset)

The multiplier controls how wide the channel sits. A value of 1.0 on a 20-period EMA with ATR-based width catches roughly 80% of price action on most liquid equities. I prefer 1.2 for QQQ swing trades - 1.0 triggers too many false touches on that name. That said, I haven't tested this on crypto pairs extensively, so mileage will vary there.
Instead of coding the channel from scratch in Pine Script, you can configure it visually in Pineify's indicator builder: pick the MA type, set the multiplier, enable bar coloring, and generate ready-to-use Pine Script code in about 30 seconds.

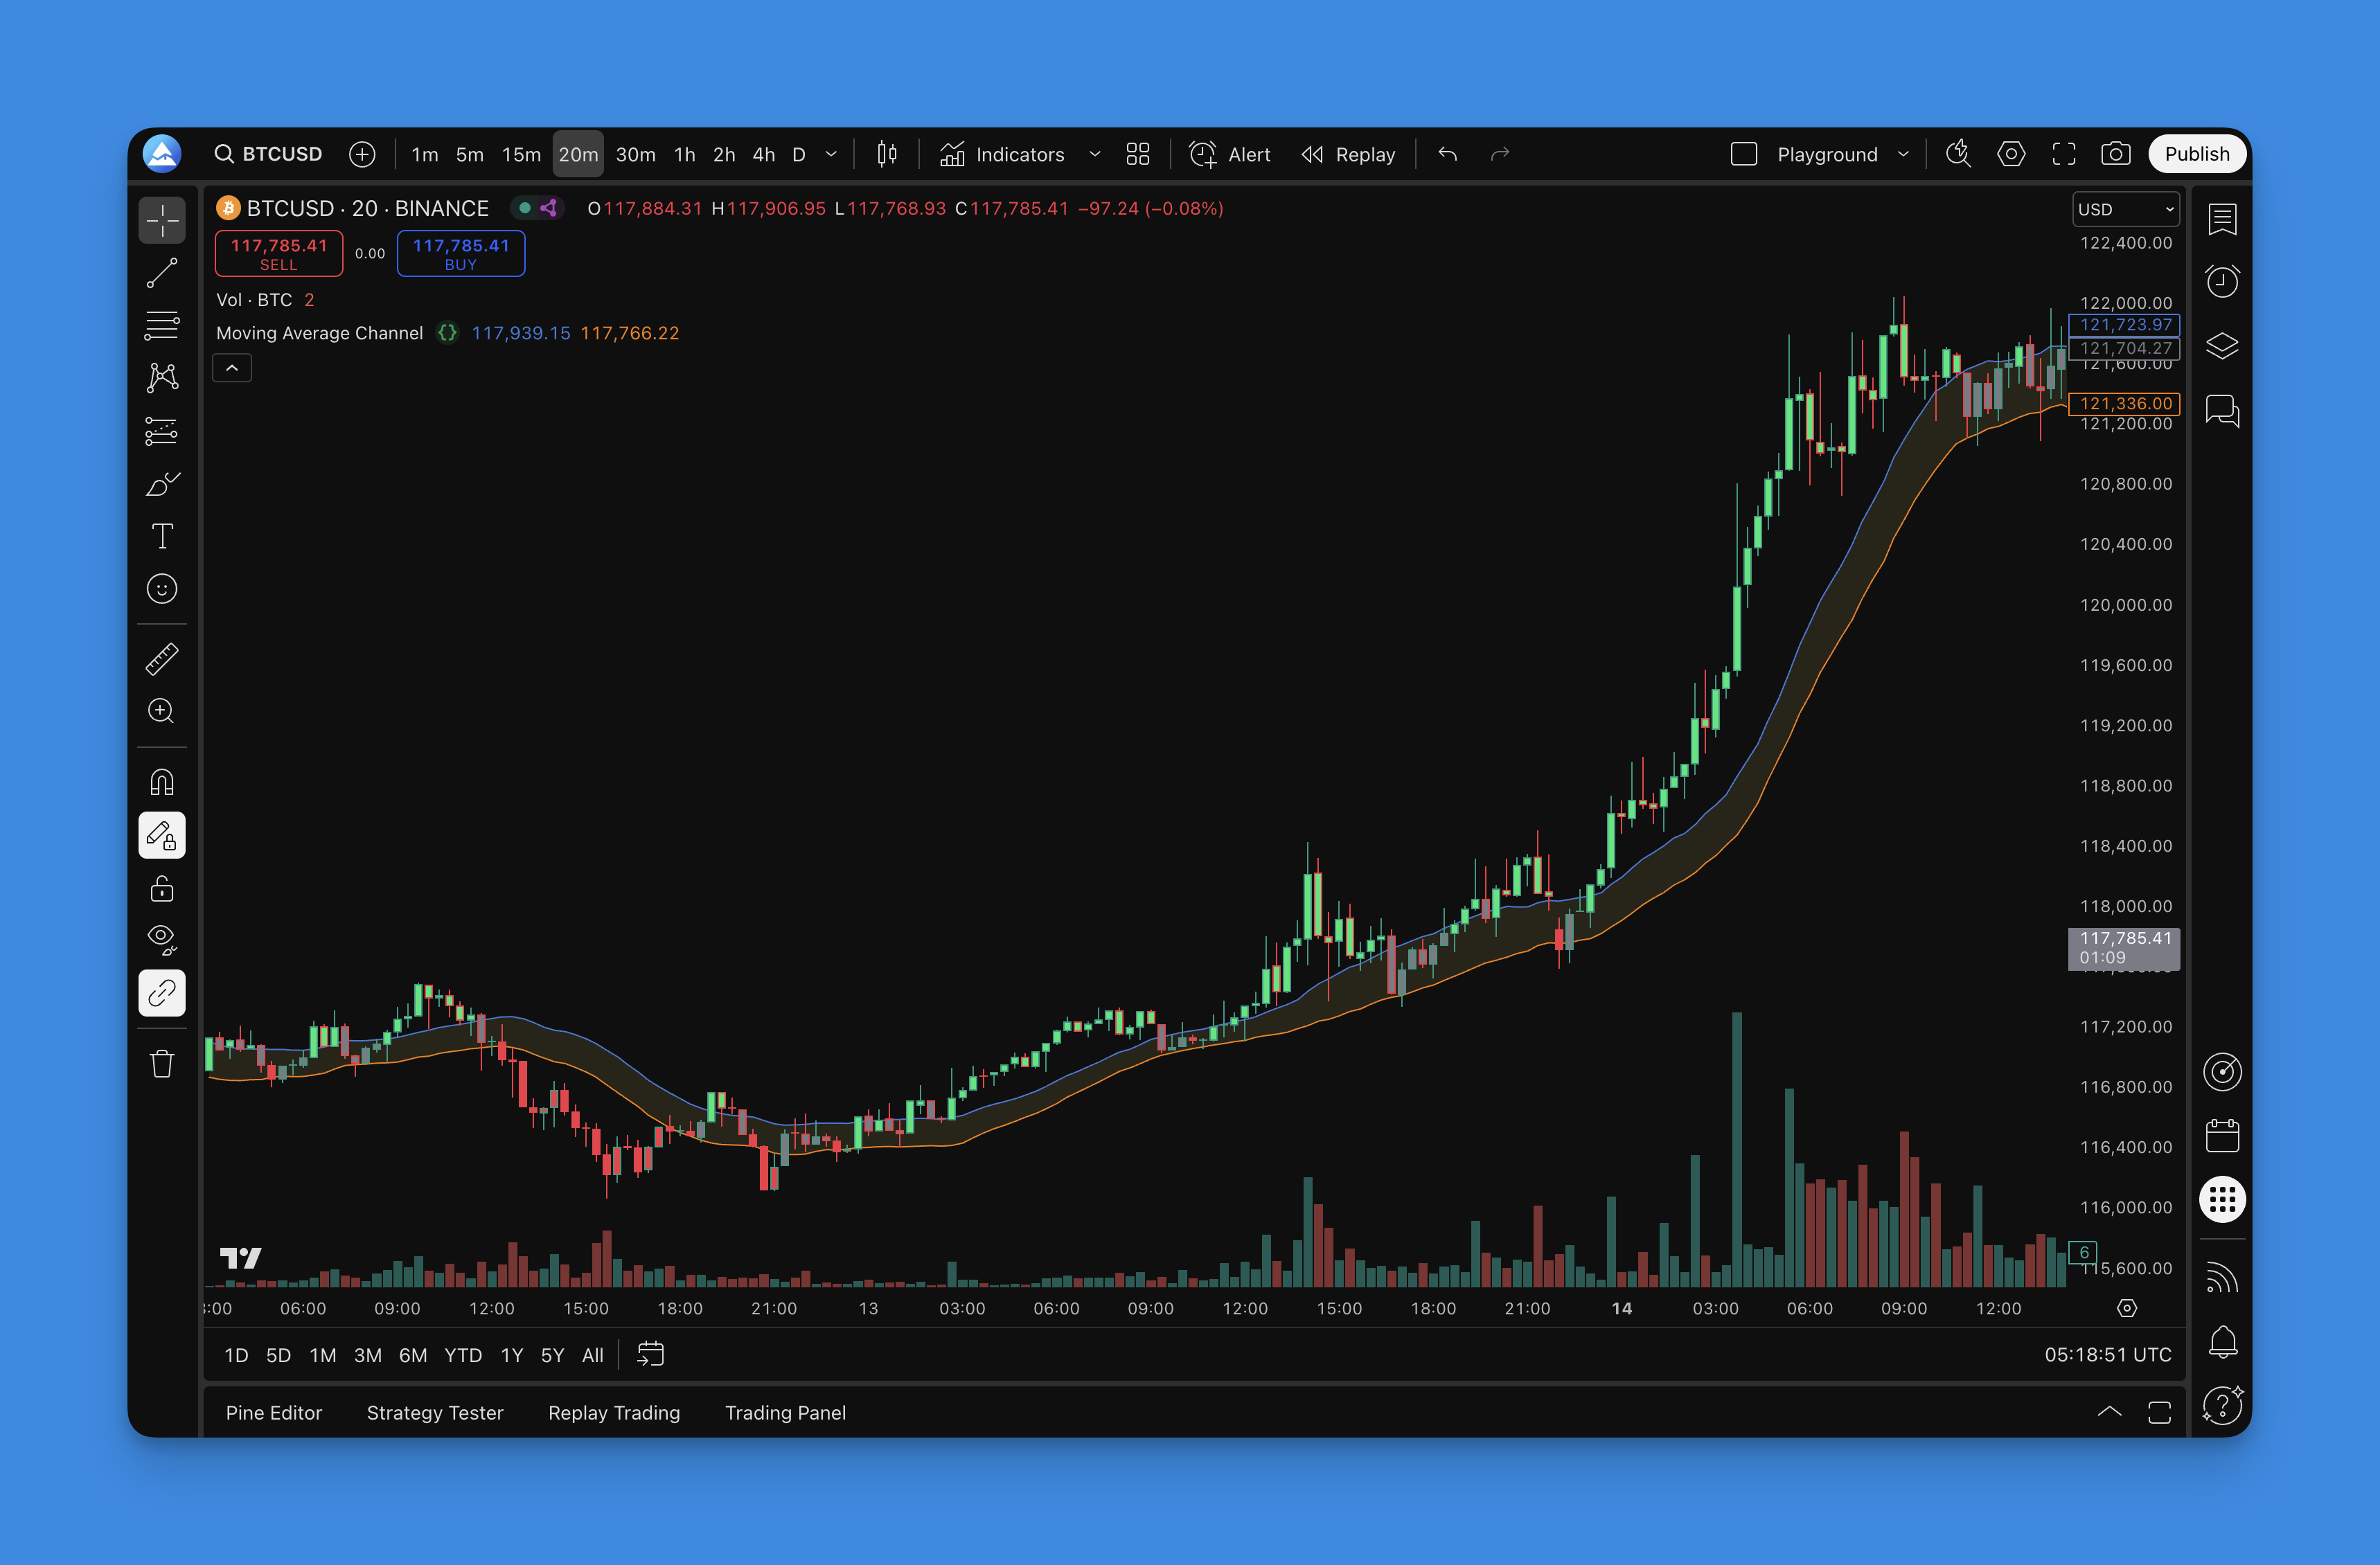
Adding the Channel to TradingView
Open the Pineify editor, search for "Moving Average Channel", adjust the settings, and hit generate. Copy the output into TradingView's Pine Editor and apply it to your chart.

Once applied, the channel lines wrap around price with a colored fill. Turn on the built-in support and resistance level feature for extra reference points that update automatically with recent price.
Trading Strategies That Work
I ran this indicator on AAPL during the August 2024 sell-off, and the channel width doubled before the gap down. That early warning gave enough time to tighten stops. Here's what I look for in practice.
Channel Breakouts
When price closes above the upper line, momentum usually carries further. A close below the lower line signals sellers are in control. The indicator marks these events with visual arrows, so they don't get missed during fast markets.
Market Sentiment Reading
- Bullish: Price stays above the upper line for multiple bars
- Bearish: Price holds below the lower line
- Neutral: Price bounces inside the channel range
Pair this with volume or a second confirmation indicator before acting. By itself, the channel generates too many signals on low-volume sessions. I combine it with other TradingView indicators for cleaner entries.
Dynamic Support and Resistance
Channel boundaries act as floating support and resistance that adapt to volatility. Static horizontal lines become irrelevant after a big move; these don't. Watch for bounce versus break when price touches the bands.
Volatility Squeeze
Channel contraction signals a squeeze. The tighter the band, the more pressure builds. On NVDA daily in January 2025, the channel compressed to its narrowest in six months before price broke upward 12% in four sessions. I track this pattern on a separate watchlist of high-beta names.
Bar Coloring
Enable it for instant visual feedback - green bars for upward momentum, red for downward, neutral for chop. Useful when scanning multiple charts quickly.
Settings for Different Trading Styles
| Style | Timeframe | Channel Length | MA Type | Multiplier |
|---|---|---|---|---|
| Day trading | 1-5 min | 10-15 | EMA or HMA | 0.5-1.0 |
| Swing trading | 1-4 hr | 20-30 | SMA or EMA | 1.0-1.5 |
| Position trading | Daily | 50-100 | SMA or ALMA | 1.5-2.0 |
Turn on bar coloring for day and swing trading. Enable the alert system for breakout notifications. A 50-period lookback works well across most setups. Backtest your strategies before committing real capital - I wasted three months on a 10-period SMA channel on 1-hour ETHUSD before realizing ALMA with 30 periods cut false signals by half.
Backtesting Your Channel Strategy
Most traders skip this step. Don't be that person. A proper backtest shows win rate, profit factor, and max drawdown before a single dollar is at risk.
Entry rules to test:
- Breakouts above or below the channel
- Bounces off dynamic support or resistance
- Squeeze setups after volatility contraction
- Confluence with a second indicator
Exit rules to test:
- Fixed profit targets at channel extension levels
- Stop loss at the opposite channel band
- Trailing stop based on channel width
- Time-based exits for intraday sessions
Pineify lets you define these rules visually and run backtests against historical data. Export the working script to TradingView once you have a setup that performs consistently.
FAQ
▶What is the Moving Average Channel indicator?
The Moving Average Channel is a volatility-adaptive envelope indicator that draws upper and lower boundaries around price using a chosen moving average. It helps traders identify the normal trading range and spot breakouts when price exits that range with momentum.
▶Which moving average type works best for the channel?
Depends on your style. EMA and HMA react faster, which works for day trading. SMA and ALMA produce smoother boundaries, which suits swing and position trading. I keep EMA for intraday and ALMA for daily charts.
▶How do you trade breakouts on this channel?
Watch for a close above the upper line for bullish breakouts or below the lower line for bearish ones. I only take the trade if volume confirms the move. Without volume, breakout failure rates are higher than most traders admit.
▶What does channel width tell you about volatility?
A narrowing channel signals low volatility and usually precedes a large directional move. A widening channel means volatility is already high. I cut position size by a third when channel width exceeds the 90th percentile.
▶What settings work for day trading versus swing trading?
Day trading on 1-5 minute charts: length 10-15, multiplier 0.5-1.0, EMA or HMA. Swing trading on 1-4 hour charts: length 20-30, multiplier 1.0-1.5, SMA or EMA. Position trading on daily charts: length 50-100, multiplier 1.5-2.0, SMA or ALMA.
▶Can this channel replace static support and resistance?
It complements them. Channel boundaries act as floating support and resistance that adapt to current volatility. I use both together - static lines for major levels, dynamic lines for entries within the trend.
▶How do you backtest a channel strategy without Pine Script?
Use Pineify's no-code builder. Configure the indicator, define entry and exit rules, run the backtest, then export the generated Pine Script to TradingView. No coding needed. I do all my initial testing this way before writing a custom script.