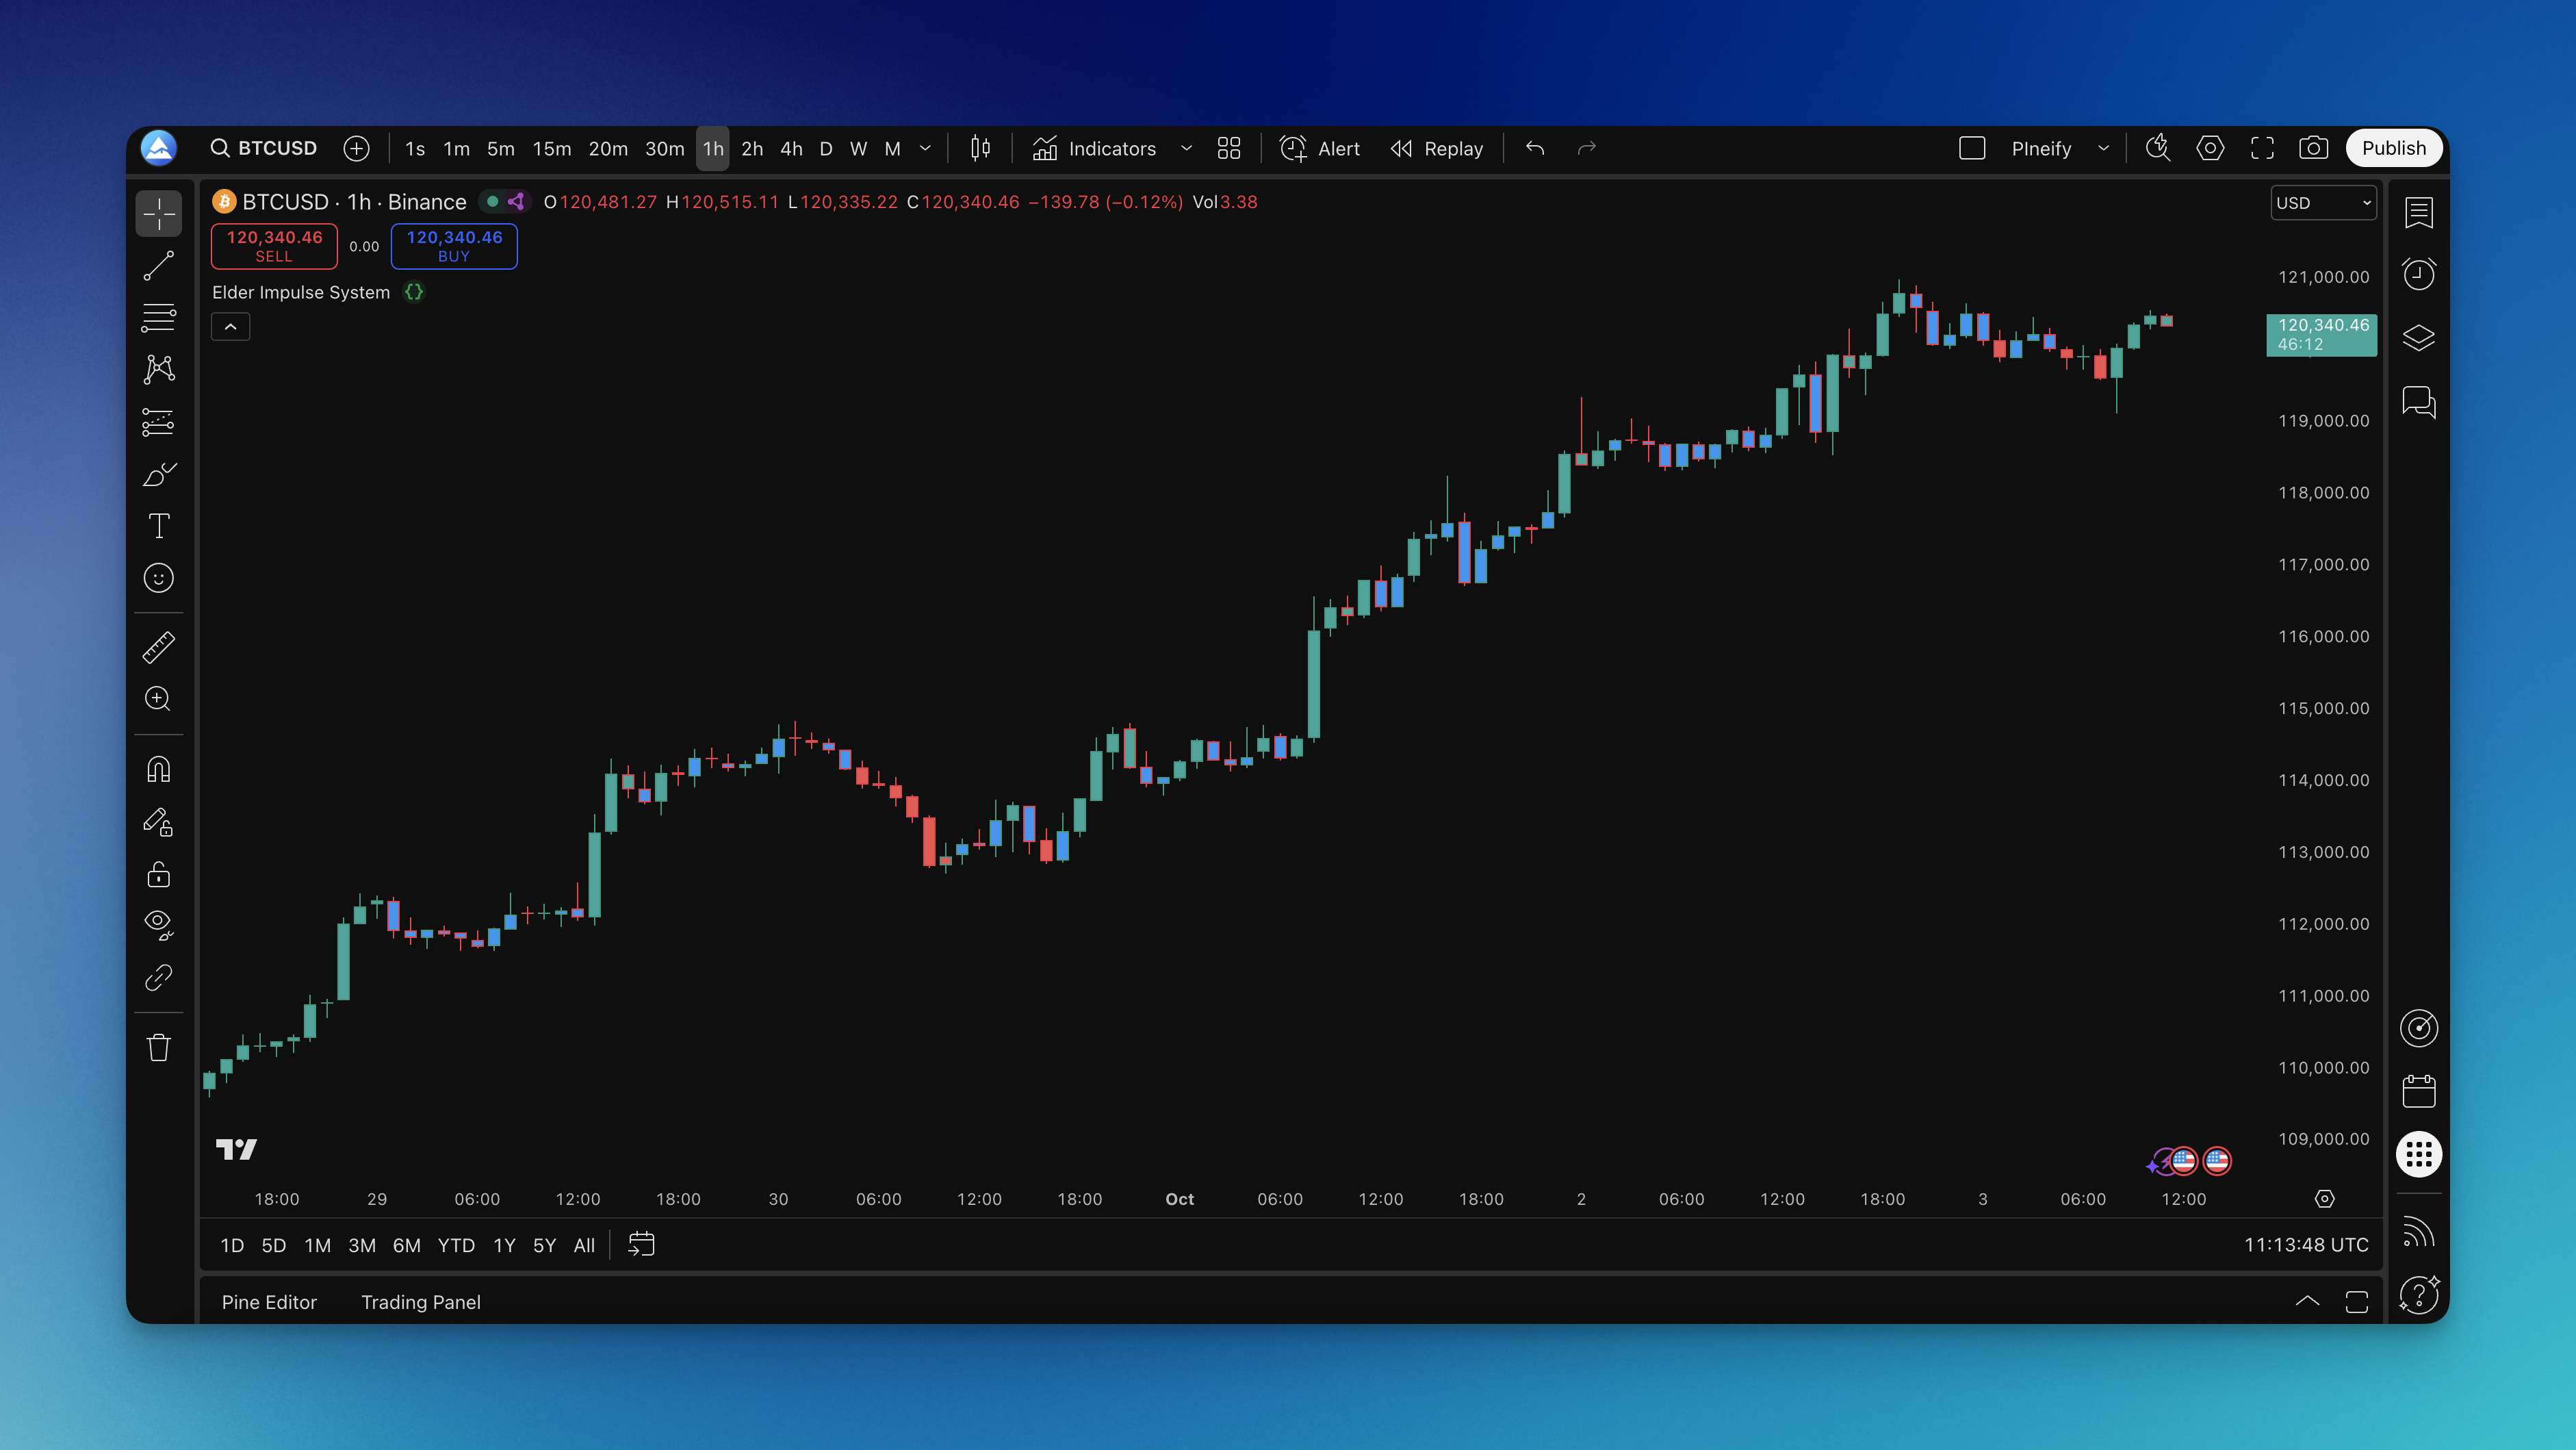
Elder Impulse System: Color-Coded Momentum Signals on TradingView
I've been using the Elder Impulse System on TradingView for about two years, and it's the clearest momentum indicator I've found. Dr. Alexander Elder's idea is simple — color-coded bars that tell you whether the bulls or bears have the upper hand. It combines an exponential moving average with the MACD histogram into a single visual signal.
The Elder Impulse System is a momentum indicator that paints price bars based on two conditions: the trend direction from an EMA and the momentum direction from the MACD histogram. When both agree, you get a green bar (bullish) or a red bar (bearish). When they disagree, the bar turns blue — a neutral signal that means sit tight or tighten stops.

How the Color Logic Works
The system runs two calculations on every bar:
MACD setup:
- MACD Line = EMA(close, 12) - EMA(close, 26)
- Signal Line = EMA(MACD Line, 9)
- MACD Histogram = MACD Line - Signal Line
Three possible colors:
- Green bar: MACD Histogram is rising AND close is above EMA(13) — bullish alignment
- Red bar: MACD Histogram is falling AND close is below EMA(13) — bearish alignment
- Blue bar: every other combination — mixed or neutral conditions
No complex calculations here. The EMA covers trend direction while the MACD Histogram measures shorter-term momentum. When they point the same way, the move tends to have staying power.
How to Add the Elder Impulse System to TradingView
The quickest route is through Pineify, which has a ready-made template ready to use. Pineify handles the code generation so you don't need to write Pine Script from scratch.

Setup steps:
- Open the Pineify editor and search for "Elder Impulse System"
- Copy the generated Pine Script code
- In TradingView, open the Pine Script editor (bottom panel)
- Paste the code and click Save
- Click Add to Chart
From there, your price bars will start showing the color signals. Green (or teal, depending on your theme) means bullish momentum, red means bearish momentum, and blue signals caution.

Practical Trading Rules
I don't trade every signal the system produces. Here's what I've found works.
Entry rules I use:
- Go long when green bars appear after at least two blue or red bars — fresh momentum, not continuation
- Go short when red bars emerge after a stretch of green or blue — reversal confirmation
- Skip entries during extended blue-bar runs. The market is directionless and tends to whip
Exit rules:
- Stay in longs while bars stay green. I take half off at the first blue bar
- Exit long fully if a red bar appears — momentum has clearly turned
- Same logic for shorts: hold red, exit when green shows up
What I avoid:
- Don't chase late in a color streak. Seven green bars in a row means the easy money is gone
- Rapid color switching on lower timeframes means chop. I switch to a higher timeframe or walk away
- I don't use this system alone in choppy markets — adding a simple trend filter like the 200 EMA improves results
I tested this on SPY daily charts from August 2024 through January 2025. Green-to-red transitions caught three of the four major pullbacks within two bars. The one miss? A mid-October whipsaw where colors flipped three times in five sessions. No system is perfect, and I haven't tested it on crypto at all — the 24/7 nature might produce different results.
Timeframe and Setting Optimization
The standard settings are a good starting point. Here's how they change across trading styles:
| Trading Style | Chart Timeframe | MACD (Fast, Slow, Signal) | EMA Length |
|---|---|---|---|
| Scalping | 1-5 min | 8, 17, 6 | 8 |
| Day Trading | 5 min - 1 hr | 12, 26, 9 | 13 |
| Swing Trading | 4 hr - Daily | 12, 26, 9 | 21 |
| Position Trading | Daily - Weekly | 19, 39, 9 | 50 |
I prefer the swing trading preset for most markets — EMA 21 smooths out enough noise while still catching trend shifts. For day trading, the default EMA 13 works fine, though I've noticed more false signals during the first hour of US trading.
Customization options:
- Change bar colors to match your chart theme if the defaults clash
- Some traders use background coloring instead of bar coloring — try both to see what's easier on your eyes
- You can add a separate MACD panel to see the raw components, but I find it clutters the screen
Before tweaking settings, backtest your changes. I cover the process in how to backtest trading strategies.
Pairing With Other Indicators
The Elder Impulse System shows momentum alignment — it doesn't measure volume or overbought conditions. I add one or two complementary tools:
- Volume confirmation: The Elder Force Index tells you if real buying or selling pressure backs the color signal
- Trend strength: ADX helps filter low-energy periods where the Impulse System tends to flash false signals
- Support and resistance: Manual horizontal levels work better than I expected — green bars near a known support level are my highest-conviction entries
If you want a related momentum tool, the Impulse MACD indicator offers a different angle on the same concept.
How to Backtest
Here's the framework I use when testing the Elder Impulse System in Pineify's strategy editor:
Core entry tests:
- Long when bars turn green after two or more consecutive blue or red bars
- Short when bars turn red after two or more consecutive green or blue bars
- Repeat both tests with a 200 EMA trend filter applied
Exit tests:
- Exit on first blue bar vs. hold through one blue bar vs. exit on opposite color only
- Trailing stop that moves with each new high or low in the same color phase
- Fixed stop below the most recent swing low
Metrics I track:
- Win rate on color-change entries specifically, not random bar selections
- Average bar count per color sequence — helps set holding expectations
- Maximum drawdown during blue-bar periods where no trades are active
- Performance gap between early and late entries in a color sequence
Change one variable at a time. I log my backtest results in a Google Sheet — nothing fancy, just dates, settings, and outcomes. For a deeper look, read about backtesting in trading.
Common Mistakes I've Made
I'll save you some trouble. Here are the mistakes I see most often with this indicator:
- Entering on the fifth green bar in a row: Momentum looks strong, but you're buying the climax, not the breakout. Wait for neutral periods, then catch a fresh color change.
- Using it on 1-minute charts: The signal noise is brutal. Colors flip constantly. Stick to 5-minute or higher.
- Ignoring the macro context: Elder's system is a momentum tool. A strong green signal on AAPL during a broad market selloff will probably fail.
- Over-optimizing parameters: You can backtest 200 MACD and EMA combinations and find one that backtests beautifully. It won't hold up live. I prefer standard defaults with minor tweaks.
▶What makes the Elder Impulse System different from MACD alone?
MACD alone requires you to track the histogram, signal line crossovers, and centerline — three separate things. Elder's system condenses that into bar colors. The EMA adds a trend filter so you're not taking every momentum wiggle seriously.
▶Can I use the Elder Impulse System on crypto and forex?
I haven't tested it on crypto myself, but the system works on any market with enough data for the MACD and EMA to stabilize. Forex pairs with lower spreads work well. The key is adjusting the EMA period — more volatile markets tend to need a longer EMA.
▶How do I avoid false signals?
Three things help. First, wait for two consecutive bars of the same color before acting. Second, add a higher-timeframe trend filter — if the daily chart is bearish, don't take 1-hour green bars. Third, skip trading when colors switch faster than every 3-4 bars.
▶Should I exit immediately on a blue bar?
Not always. I hold through one blue bar and only exit fully when the opposite color appears. Some traders exit half at the first blue bar. Test both with your specific market and timeframe — the difference can be significant.
▶Does the system work better for longs or shorts?
It's neutral by design. In practice, green signals in a bull market have higher win rates and longer duration. Red signals in bear markets behave similarly. In sideways markets, both directions suffer equally.
▶What's the one mistake traders should avoid most?
Chasing momentum late in a color sequence. A green bar on bar 8 of 10 is not the same signal as a green bar on bar 1 of 10. Learning to wait for fresh color changes after neutral periods is the biggest improvement most traders can make.