

Best RSI settings for 1-minute charts
There is no universal best setting. Start by testing RSI 7 with 80/20 levels against the TradingView default, RSI 14 with 70/30 levels. Keep the same symbol, session, fees, and date range so the comparison is fair.
A useful starting point, not a trading promise
On a 1-minute NQ or QQQ chart, RSI 7 reacts faster than RSI 14. Wider 80/20 bands reduce the number of extreme readings. You still need a backtest because speed and signal quality are not the same thing.
An RSI reading describes momentum. Pineify turns the rule you choose into executable TradingView Pine Script so you can test the rule before using it.
Settings table
Compare RSI 5, 7, 9, and 14
These are test candidates. The table describes how the lookback changes the indicator, not which setting will make money.
| RSI length | Levels | Behavior | Test use |
|---|---|---|---|
| 5 | 80 / 20 | Fastest response and the most sensitivity to single-bar moves. | A stress-test candidate for very short holding periods. |
| 7 | 80 / 20 | Faster than the default while keeping a short smoothing window. | A practical first test for 1-minute NQ or QQQ charts. |
| 9 | 75 / 25 | Slower than RSI 7, with fewer threshold crosses. | A middle option when RSI 7 reacts too often. |
| 14 | 70 / 30 | TradingView default and the slowest baseline in this comparison. | The control setting for every short-period test. |
Keep the market fixed
Test NQ and QQQ separately. Their sessions and price series do not create identical one-minute bars.
Keep costs in the model
Commission and slippage matter more when a rule trades frequently and targets small moves.
Keep a holdout period
Pick settings on one date range, then test them on dates you did not use during selection.
Pine Script v6
Copy an RSI settings tester
Change the length and levels in TradingView without editing the formula. The script marks crosses back above the lower band and back below the upper band.
//@version=6
indicator("RSI Settings Tester", overlay = false)

rsiLength = input.int(7, "RSI length", minval = 2)
upperLevel = input.float(80.0, "Overbought level", minval = 50, maxval = 100)
lowerLevel = input.float(20.0, "Oversold level", minval = 0, maxval = 50)

rsiValue = ta.rsi(close, rsiLength)

plot(rsiValue, "RSI", color = color.rgb(37, 99, 235), linewidth = 2)
upperBand = hline(upperLevel, "Overbought", color = color.rgb(220, 38, 38))
middleBand = hline(50, "Midline", color = color.new(color.gray, 40))
lowerBand = hline(lowerLevel, "Oversold", color = color.rgb(22, 163, 74))
fill(upperBand, lowerBand, color = color.new(color.blue, 92))

bullishCross = ta.crossover(rsiValue, lowerLevel)
bearishCross = ta.crossunder(rsiValue, upperLevel)

plotshape(bullishCross, "Cross above oversold", shape.triangleup, location.bottom, color.green, size = size.tiny)
plotshape(bearishCross, "Cross below overbought", shape.triangledown, location.top, color.red, size = size.tiny)

alertcondition(bullishCross, "RSI crossed above oversold", "RSI crossed above the oversold level")
alertcondition(bearishCross, "RSI crossed below overbought", "RSI crossed below the overbought level")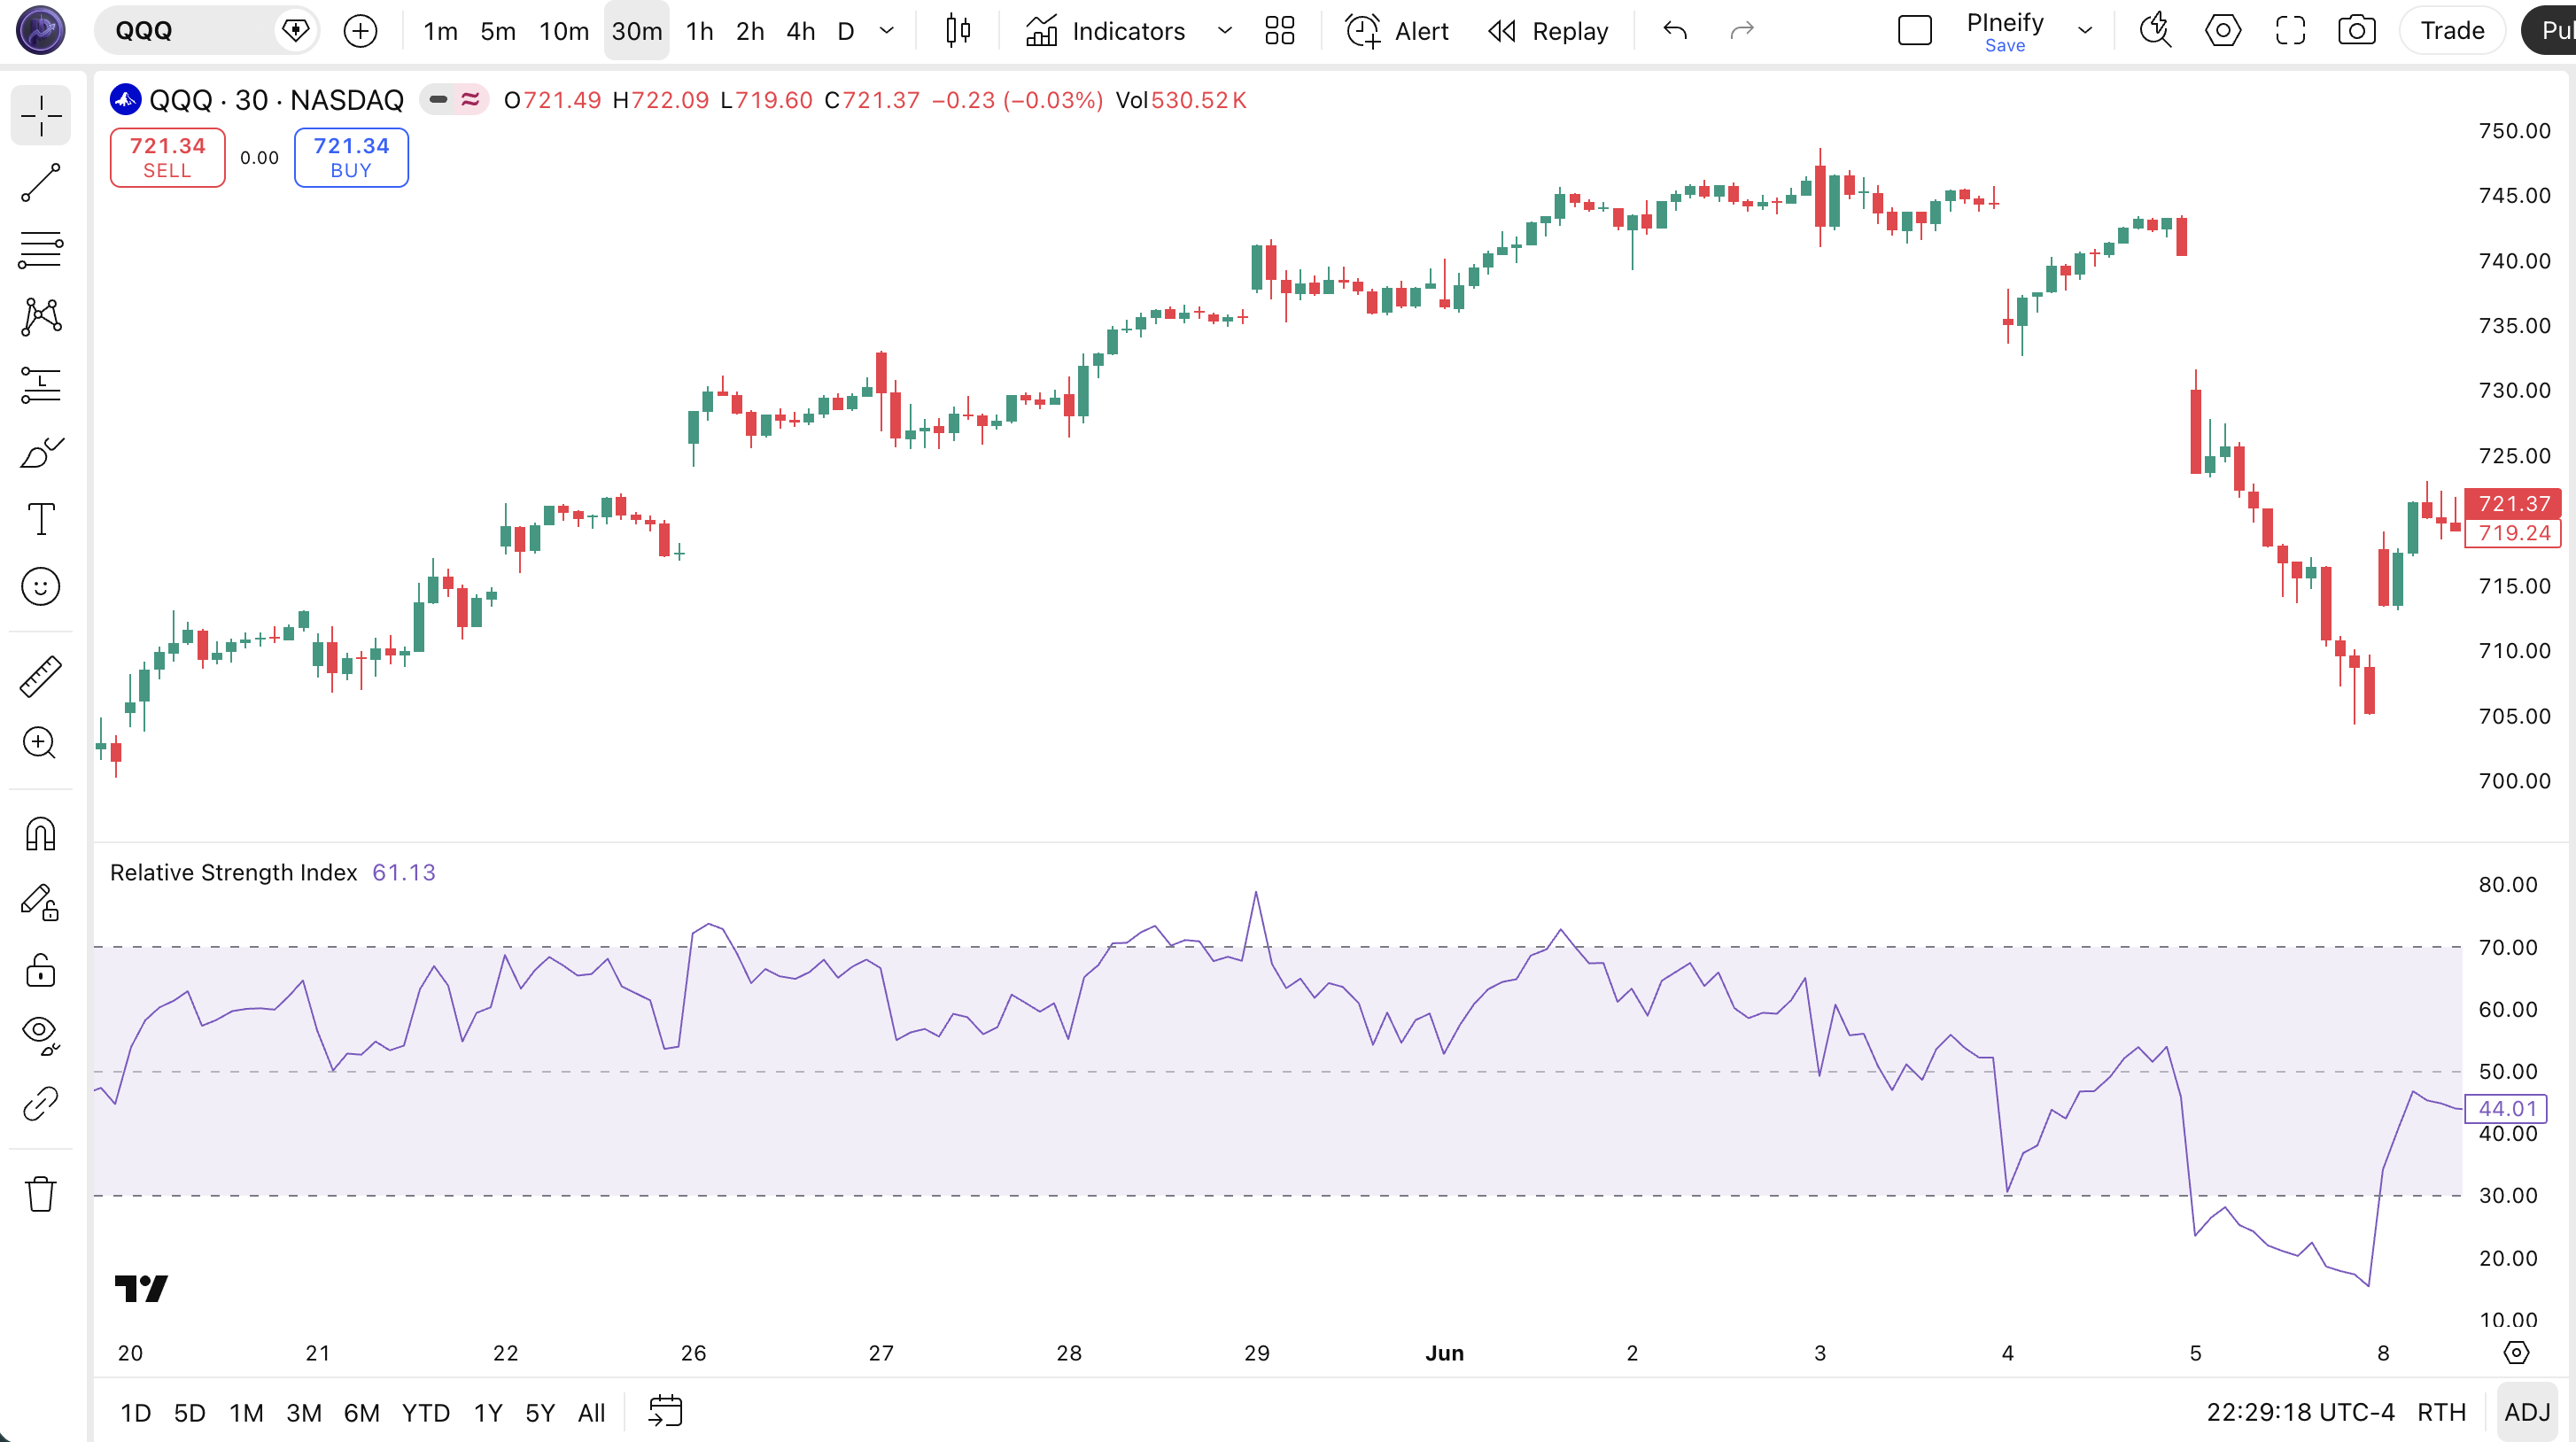
The preview uses a standard RSI pane. Your one-minute result will depend on the chart symbol, session, and selected inputs.
Signal rules
Read the crossover, not the label alone
Overbought and oversold describe recent momentum. They do not say that price must reverse on the next bar.
| Event | Pine condition | What it says | What it does not say |
|---|---|---|---|
| Cross above oversold | ta.crossover(rsi, lower) | RSI has moved back above the lower threshold. | Price has not necessarily formed a durable bottom. |
| Cross below overbought | ta.crossunder(rsi, upper) | RSI has moved back below the upper threshold. | Price has not necessarily formed a durable top. |
| Cross above 50 | ta.crossover(rsi, 50) | Smoothed gains now outweigh smoothed losses. | The next price bar is not guaranteed to close higher. |
When I review a 1-minute RSI setup, I start with one clear event, such as a cross above 20, and add a trend filter only after the basic rule has been measured. Adding several filters at once makes it hard to tell which condition changed the result.
Testing method
Test a 1-minute RSI without fitting the answer
A short chart interval produces many observations. That makes it easy to find a setting that looks good by chance.
- 1
Write one entry event
Example: RSI 7 crosses above 20 while price is above the 200 EMA. Define the exit before running the test.
- 2
Use the same data window
Compare RSI 5, 7, 9, and 14 on the same NQ, QQQ, or SPY dates. Do not change the market halfway through.
- 3
Include trading costs
Add commission and a slippage assumption. A frequent one-minute rule can lose its apparent edge after costs.
- 4
Reserve unseen dates
Choose the candidate on one period and check it on a later period that was not used to select the settings.
- 5
Compare stability, not one peak
Reject a setting when small changes to fees, dates, or thresholds erase the result.
I compare the rule on NQ and QQQ as separate tests. I also keep the default RSI 14 result beside the shorter settings. That baseline makes it obvious when a faster setting only adds more trades without improving the test.
Indicator comparison
Stochastic vs RSI on short charts
Both indicators use a bounded scale, but their inputs differ. Use the one that matches the rule you want to test.
| Question | RSI | Stochastic |
|---|---|---|
| What is measured? | Smoothed gains compared with smoothed losses. | Latest close compared with the recent high-low range. |
| Common default | 14, with 70 / 30 | 14, 3, 3 with 80 / 20 |
| Typical rule | Threshold, centerline, or divergence event. | Percent K and percent D crossover or threshold event. |
| Main limitation | RSI can remain at an extreme during a strong trend. | Range-based readings can change quickly on short charts. |
For a fuller comparison, read Stochastic Oscillator vs RSI.
FAQ
RSI settings questions
Each answer starts with the conclusion, then states the constraint that matters.
Risk note
This page is an information and testing tool, not investment advice. RSI cannot predict returns. Backtests can overstate a rule when they omit fees, slippage, changing market conditions, or out-of-sample testing.
Turn your RSI rule into Pine Script
Describe the length, levels, filters, and alerts. Pineify writes the TradingView code so you can inspect and test the rule.
Related RSI tools
RSI Calculator
Calculate the Relative Strength Index to identify overbought or oversold conditions.
RSI Screener
Scan daily RSI 14 readings across stocks, crypto pairs, and ETFs. Spot overbought, oversold, bullish, bearish, and neutral momentum zones.
RSI Divergence Scanner
Understand regular and hidden RSI divergence, pivot pairing, confirmation delays and failed reversals. Review daily stock candidates with the RSI divergence scanner.
RSI Overbought Oversold Strategy Tutorial
Compare RSI threshold entries, recovery crosses and EMA trend filters. Test a Pine Script v6 strategy with explicit stops, costs and time exits on TradingView.
How to Create RSI in TradingView
Learn how to create and customize the RSI indicator in TradingView using Pine Script. Covers RSI formulas, divergence detection, and visual editing with Pineify.