Take Profit Indicator TradingView: How to Set Your Best Exit Targets

A take profit indicator is a TradingView tool that calculates optimal exit points for locking in gains based on volatility, price structure, or risk-reward math. Instead of guessing where the market might top or bottom out, it gives you data-backed price levels to close your trade. On TradingView, you get a full toolkit of these indicators. They use different methods — measuring market swings with ATR, balancing risk against reward with ratio calculators, or marking Fibonacci levels — to tell you when to take money off the table. I've been using ATR-based take profit levels on SPY daily charts for about two years, and switching from gut-feel exits to a systematic approach made a clear difference in my consistency. For a broader look at trend confirmation, check out our guide on the Know Sure Thing (KST) Indicator.
How Take Profit Indicators Work on TradingView
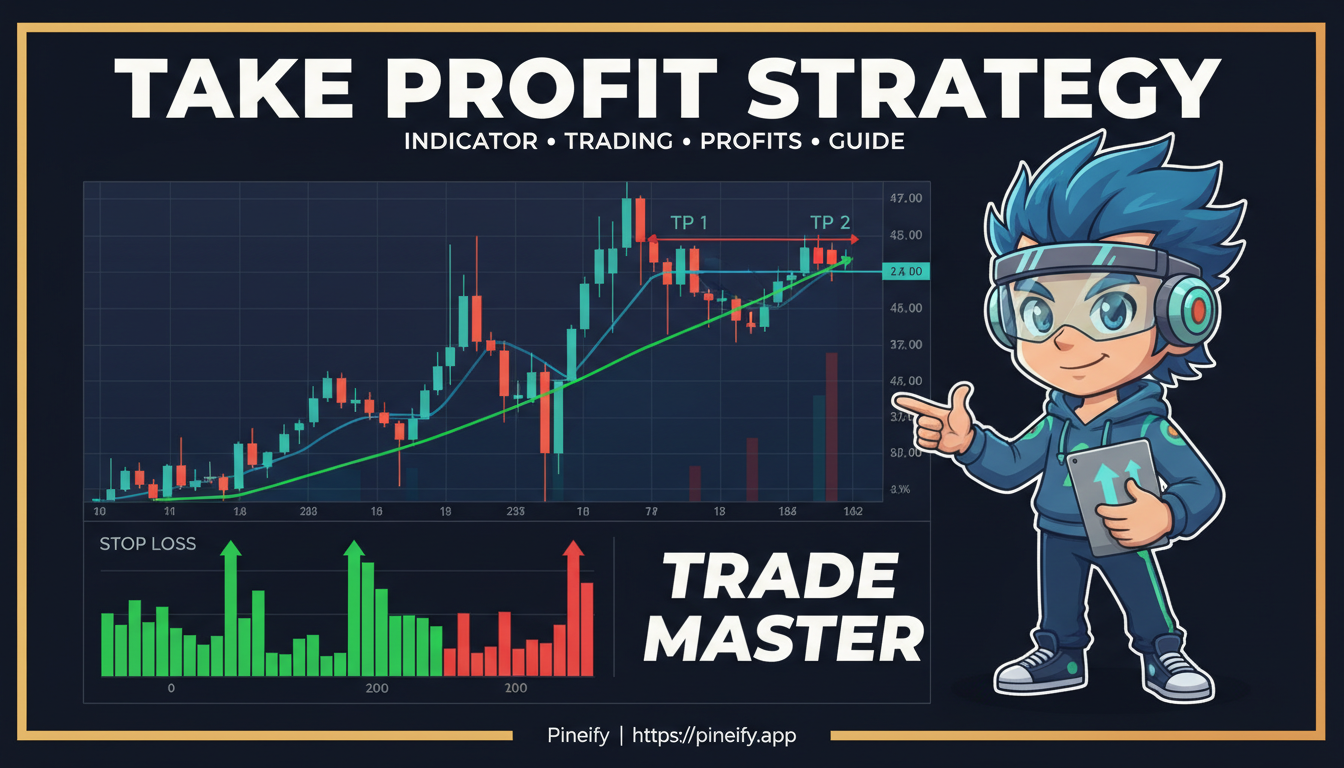
A take profit indicator acts as your automated exit strategist. It calculates specific price levels where closing your position makes strategic sense. Instead of relying on a gut feeling, it uses math based on volatility or recent price movement to pinpoint where to take money off the table. Most indicators on TradingView can display several profit targets at once — TP1, TP2, TP3 — so you can close parts of your trade in stages as the price moves in your favor.
These tools connect with TradingView's alert system. You can set alerts that fire the moment price hits one of your calculated targets. That's a huge help if you can't watch the charts all day, or if you want to remove the temptation to exit a good trade too early or hold on for too long.
Choosing the Right Take Profit Method
Picking a spot to exit for profit is tricky. Guessing a round number often doesn't work. The best approach uses the market's own behavior as your guide. Here are the most practical methods I've found on TradingView.
ATR-Based Take Profit: Let Volatility Set Your Targets
Formula: TP = Entry Price + (ATR x N), where N is your chosen multiplier for long trades. For short trades: TP = Entry Price - (ATR x N).
The Average True Range (ATR) measures how much a market typically moves over a given period. Instead of picking a random target, ATR-based indicators set your take profit levels at multiples of the current ATR value. Here's a common setup:
| Profit Target | Default ATR Multiple |
|---|---|
| TP1 | 1x ATR |
| TP2 | 1.5x ATR |
| TP3 | 2x ATR |
You can push targets further out, like 5x ATR, for bigger moves. Some versions, like the ATR+ indicator, also suggest a stop loss at 1.5x ATR and help calculate position size based on your risk tolerance.
Timeframe matters here. Here's what I typically use:
| Timeframe | ATR Period | Notes |
|---|---|---|
| 1-min to 5-min | 7-10 | Faster adjustments for day trading |
| 15-min to 1-hour | 10-14 | Balanced for intraday swings |
| Daily | 14-20 | Standard for swing trades |
| Weekly | 14 | Slower, captures broader trends |
When the market gets volatile, your profit targets move further away — giving the trade room to breathe. When things calm down, targets come in closer so you lock in gains before the price swings back. I prefer 2x ATR on SPY daily for swing trades, but on BTCUSD I dial it up to 3x because crypto moves are wider.
SMRT Algo Pro V3: All-in-One Exit System
This is more than a take profit tool — it's a full trading system with smart exit management. It gives you three display modes on your chart:
- Hybrid Mode: Shows entry, stop loss, and take profit lines, plus circles (TP1, TP2, TP3) marking where to take profit.
- Minimal Mode: Shows only the clean circles.
- Traditional Mode: Displays just the lines.
It calculates take profits based on risk/reward ratios (like 1:2 or 1:3) relative to your stop loss. It also checks trend strength before giving a signal, so you're setting targets in the direction the market is actually moving.
Fibonacci Take Profit Levels
This method uses Fibonacci retracement levels to find logical price targets. The indicator sets a series of take profit levels at percentage steps above your entry (for buys) or below it (for sells).
The real advantage? You decide what percentage of your trade to close at each level. Maybe 30% at the first target, 30% at the next, and let the final 40% run. You book some profit early while keeping a position open for a bigger move.
Risk/Reward Calculators
These aren't glamorous, but they might be the most important tools for staying disciplined. They force you to plan the entire trade before you click "buy."
- Risk Reward Calculator by TradeINski: You tell it how much you're willing to risk and your desired reward. It calculates where your stop loss and take profit need to be, and even suggests position size.
- Profit & Risk Calculator by MIJNACCOUNTS: It measures the distance from entry to stop and take profit, then shows the risk-to-reward ratio. A perfect final check before entering.
I haven't tested these on crypto pairs, but they work well for stocks and forex. The key is to never enter a trade blindly — every potential reward should justify the risk.
Trailing Take Profit: Locking In Gains During Trends
What happens when a trade hits your initial target and keeps going? A fixed take profit would close you out too early. A trailing take profit solves this.
Once your first target is hit, the indicator sets a trailing stop order. This stop follows the price up at a set distance and only moves up, never down. If the price surges, your trailing stop surges with it. If the price reverses and hits that moving stop, you exit. You capture those big trending moves without guessing a top.
Setting Up Take Profit Indicators on Your Charts
Here's how to actually use these indicators without overcomplicating things.
Add and Configure Your Indicator
Open TradingView, click 'Indicators,' search for your take profit tool, and add it to your chart. Don't just use the defaults — think about your own style:
- Aggressive trader, looking for bigger moves? Use a larger ATR multiplier or wider targets.
- More conservative, protecting gains quickly? Use tighter, closer targets.
For ATR-based indicators, the standard 14-period setting is a solid starting point for daily charts. If you're day trading on 5-minute charts, drop it to 7 or 10 periods so levels adjust faster to recent volatility.
Integrate It Into Your Trading Plan
An indicator alone isn't a strategy. The real value comes when you weave it into your existing system.
Say your main system gives you a buy signal on AAPL. Instead of guessing where to take profit, your indicator gives you clear levels — a near target (TP1), a medium one (TP2), and a runner (TP3). Close 30-40% at TP1, another chunk at TP2, and let the last piece ride to TP3 with a trailing stop. You lock in gains while still catching a bigger trend.
Always check your targets against the bigger picture. If your indicator gives you a target, glance at a higher timeframe. Is that target sitting right at a known resistance area? That strengthens the case for it. The Moving Average Ribbon can help you quickly assess trend strength and alignment.
Automate With Alerts
You don't need to stare at the screen. TradingView's alert system watches for you.
When you create an alert on your indicator, use variables like {{plot_1}} or {{plot_2}} in the alert message. These are replaced with the actual price levels your indicator plots. You can get notified on your phone or connect it through a trading platform to automatically close the trade at that price.
If you code strategy scripts, build the take profit logic into the backtest. Use strategy.exit() with limit orders to test how your rules would have performed over years of data. It's the best way to gain confidence before risking real money.
If manually coding Pine Script exit rules sounds time-consuming, there's a faster option. Platforms like Pineify let you visually build complex take profit and stop-loss logic — multi-target exits with trailing stops — without writing code. Import any indicator, set your conditions, and generate a ready-to-backtest strategy in minutes. It turns a solid exit plan into a testable script fast.
Scaling Out: Why Partial Exits Beat All-or-Nothing
Most traders don't sell their entire position at one magic number. They "scale out" in parts. This approach smooths your results and improves your overall returns.
| Target Level | Typical Risk-Reward | What It Does |
|---|---|---|
| TP1 | 1:1 (Risk = Reward) | Banks your initial risk. Move your stop to breakeven, making the rest of the trade "free." |
| TP2 | 1:2 or 1.5:1 | Captures a solid gain. Take profit on another chunk. |
| TP3 | 1:3 or beyond | Lets a smaller portion ride for a potential big move. |
You get the psychological win of securing some profit early and the mathematical edge of staying in a trade that keeps going your way.
Adjust to Market Conditions
The market has different moods, and your targets should adapt.
- Choppy, sideways market: Prices reverse quickly. Use tighter targets — smaller ATR multipliers or percentage gains. Grab profits before the price bounces back.
- Strong trend: Your goal is to stay in the move. Use wider targets — trailing stops or larger ATR multipliers. Let the trade breathe.
I set up two chart templates in TradingView — one for ranging markets and one for trending markets — and switch between them as conditions change.
Backtest Before You Trust
Don't guess with real money. Test your profit-taking plan first. TradingView's strategy tester is perfect for this.
Look beyond total return. Check these metrics:
- Profit Factor: Did the strategy make more than it lost?
- Win Rate: How often were you right?
- Maximum Drawdown: What's the worst it got?
The test shows if your targets are too tight (leaving money on the table) or too wide (watching profits shrink). Use this to tune your ATR multipliers or risk-reward ratios.
Common Mistakes With Take Profit Indicators
Here are the slip-ups I've seen (and made myself) and how to avoid them.
Ignoring Market Volatility
Using a fixed price target without checking current volatility is a setup for failure. What works when things are calm might be impossible to hit when the market is barely moving. During volatile periods, that same target could get hit too quickly.
ATR-based indicators solve this by automatically adjusting targets to recent price swings. Before you place any trade, check if the suggested targets make sense given recent price action.
Overloading Your Chart
TradingView has tons of great indicators, but piling on every take profit tool leads to conflicting signals and confusion. You end up frozen, unable to decide.
Stick to one main method. Add one complementary tool at most. For example, pair an ATR-based indicator with a simple risk-reward calculator. You'll get better results from a simple, well-understood setup than from jumping between tools. If you want to clean up your charts, check out How to Fill Areas Between Lines in Pine Script for making your analysis clearer.
Setting Profit Targets Without Stop Losses
Your take profit level needs to work with your stop loss to maintain a sensible risk-reward ratio. It makes no sense to have a 1:1 profit target if your stop loss is placed randomly.
The best tools (ATR+, SMRT Algo) calculate stop loss and take profit together as a single system. Never set one without the other.
Frequently Asked Questions
What is a take profit indicator on TradingView?
A take profit indicator is an automated tool that calculates specific price levels for closing a trade at a profit. Instead of guessing where to exit, it uses math based on market volatility, recent price movements, or risk-reward ratios to mark optimal exit points. On TradingView, many of these indicators show multiple profit targets (TP1, TP2, TP3), so you can scale out of positions in stages as the price moves in your favor.
How do I automate take profit orders in TradingView?
You have two options. The simpler one uses TradingView's alert system. Add a take profit indicator to your chart, set an alert using plot values like {{plot_1}} or {{plot_2}}, and connect it to a brokerage or auto-trading service. For full automation, use a Pine Script strategy with the strategy.exit() function to define your take profit levels directly in code.
Should I use multiple take profit levels or just one?
Multiple take profit levels let you scale out of trades — take some profit early to lock in a win, but leave a portion running to catch a bigger move. Most pro-style indicators calculate three levels at common risk-reward ratios (1:1, 1:2, and 1:3). This helps manage greed and fear while still letting winners run.
What is the difference between trailing take profit and fixed take profit?
A fixed take profit stays at a predetermined price level — you set it once and it does not move. That makes it ideal for ranging markets with clear support and resistance. A trailing take profit dynamically follows the price upward (in a long trade), always staying a set distance below the highest price reached. If the price reverses and hits that trailing level, you exit. This works well for capturing sustained trends without exiting too early.
How do I choose the right ATR multiplier for take profit levels?
Start with the defaults: TP1 at 1x ATR, TP2 at 1.5x to 2x ATR, and TP3 at 2x to 3x ATR. Day traders usually need smaller multipliers (0.5x to 2x ATR) for quicker moves. Swing traders may stretch to 3x or 5x ATR to capture multi-day trends. I'd recommend backtesting different multipliers on historical data to see what works for your specific strategy and market.
Can I use take profit indicators for both stocks and crypto?
Yes. Well-built take profit indicators use percentage-based or volatility-based calculations that adjust automatically. An ATR-based indicator naturally handles different volatility levels, giving wider targets for volatile crypto and tighter targets for stable stocks. You may need to fine-tune settings between asset classes, but the same indicator works across both.
Practical First Steps
Pick one take profit indicator to start with — an ATR-based one or SMRT Algo Pro V3. Add it to your chart and test it on TradingView's paper trading for a week. Take notes: are your trades closing before the full move, or are you holding on too long? Those notes tell you exactly how to adjust your settings.
Use TradingView's strategy tester to backtest your take profit plan before risking real money. See how it would have performed in different market conditions — calm trends, volatile swings, everything.
An indicator is just one piece of your trading system. It works best as part of a complete plan with entry rules, stop loss placement, and risk sizing. When a good take profit tool is paired with solid risk management, that's when things click.
Start small, log your results, and adjust as you learn. The goal is steady progress, not instant perfection.