Best Congress Insider Trading Viewer: Pineify Market Insights

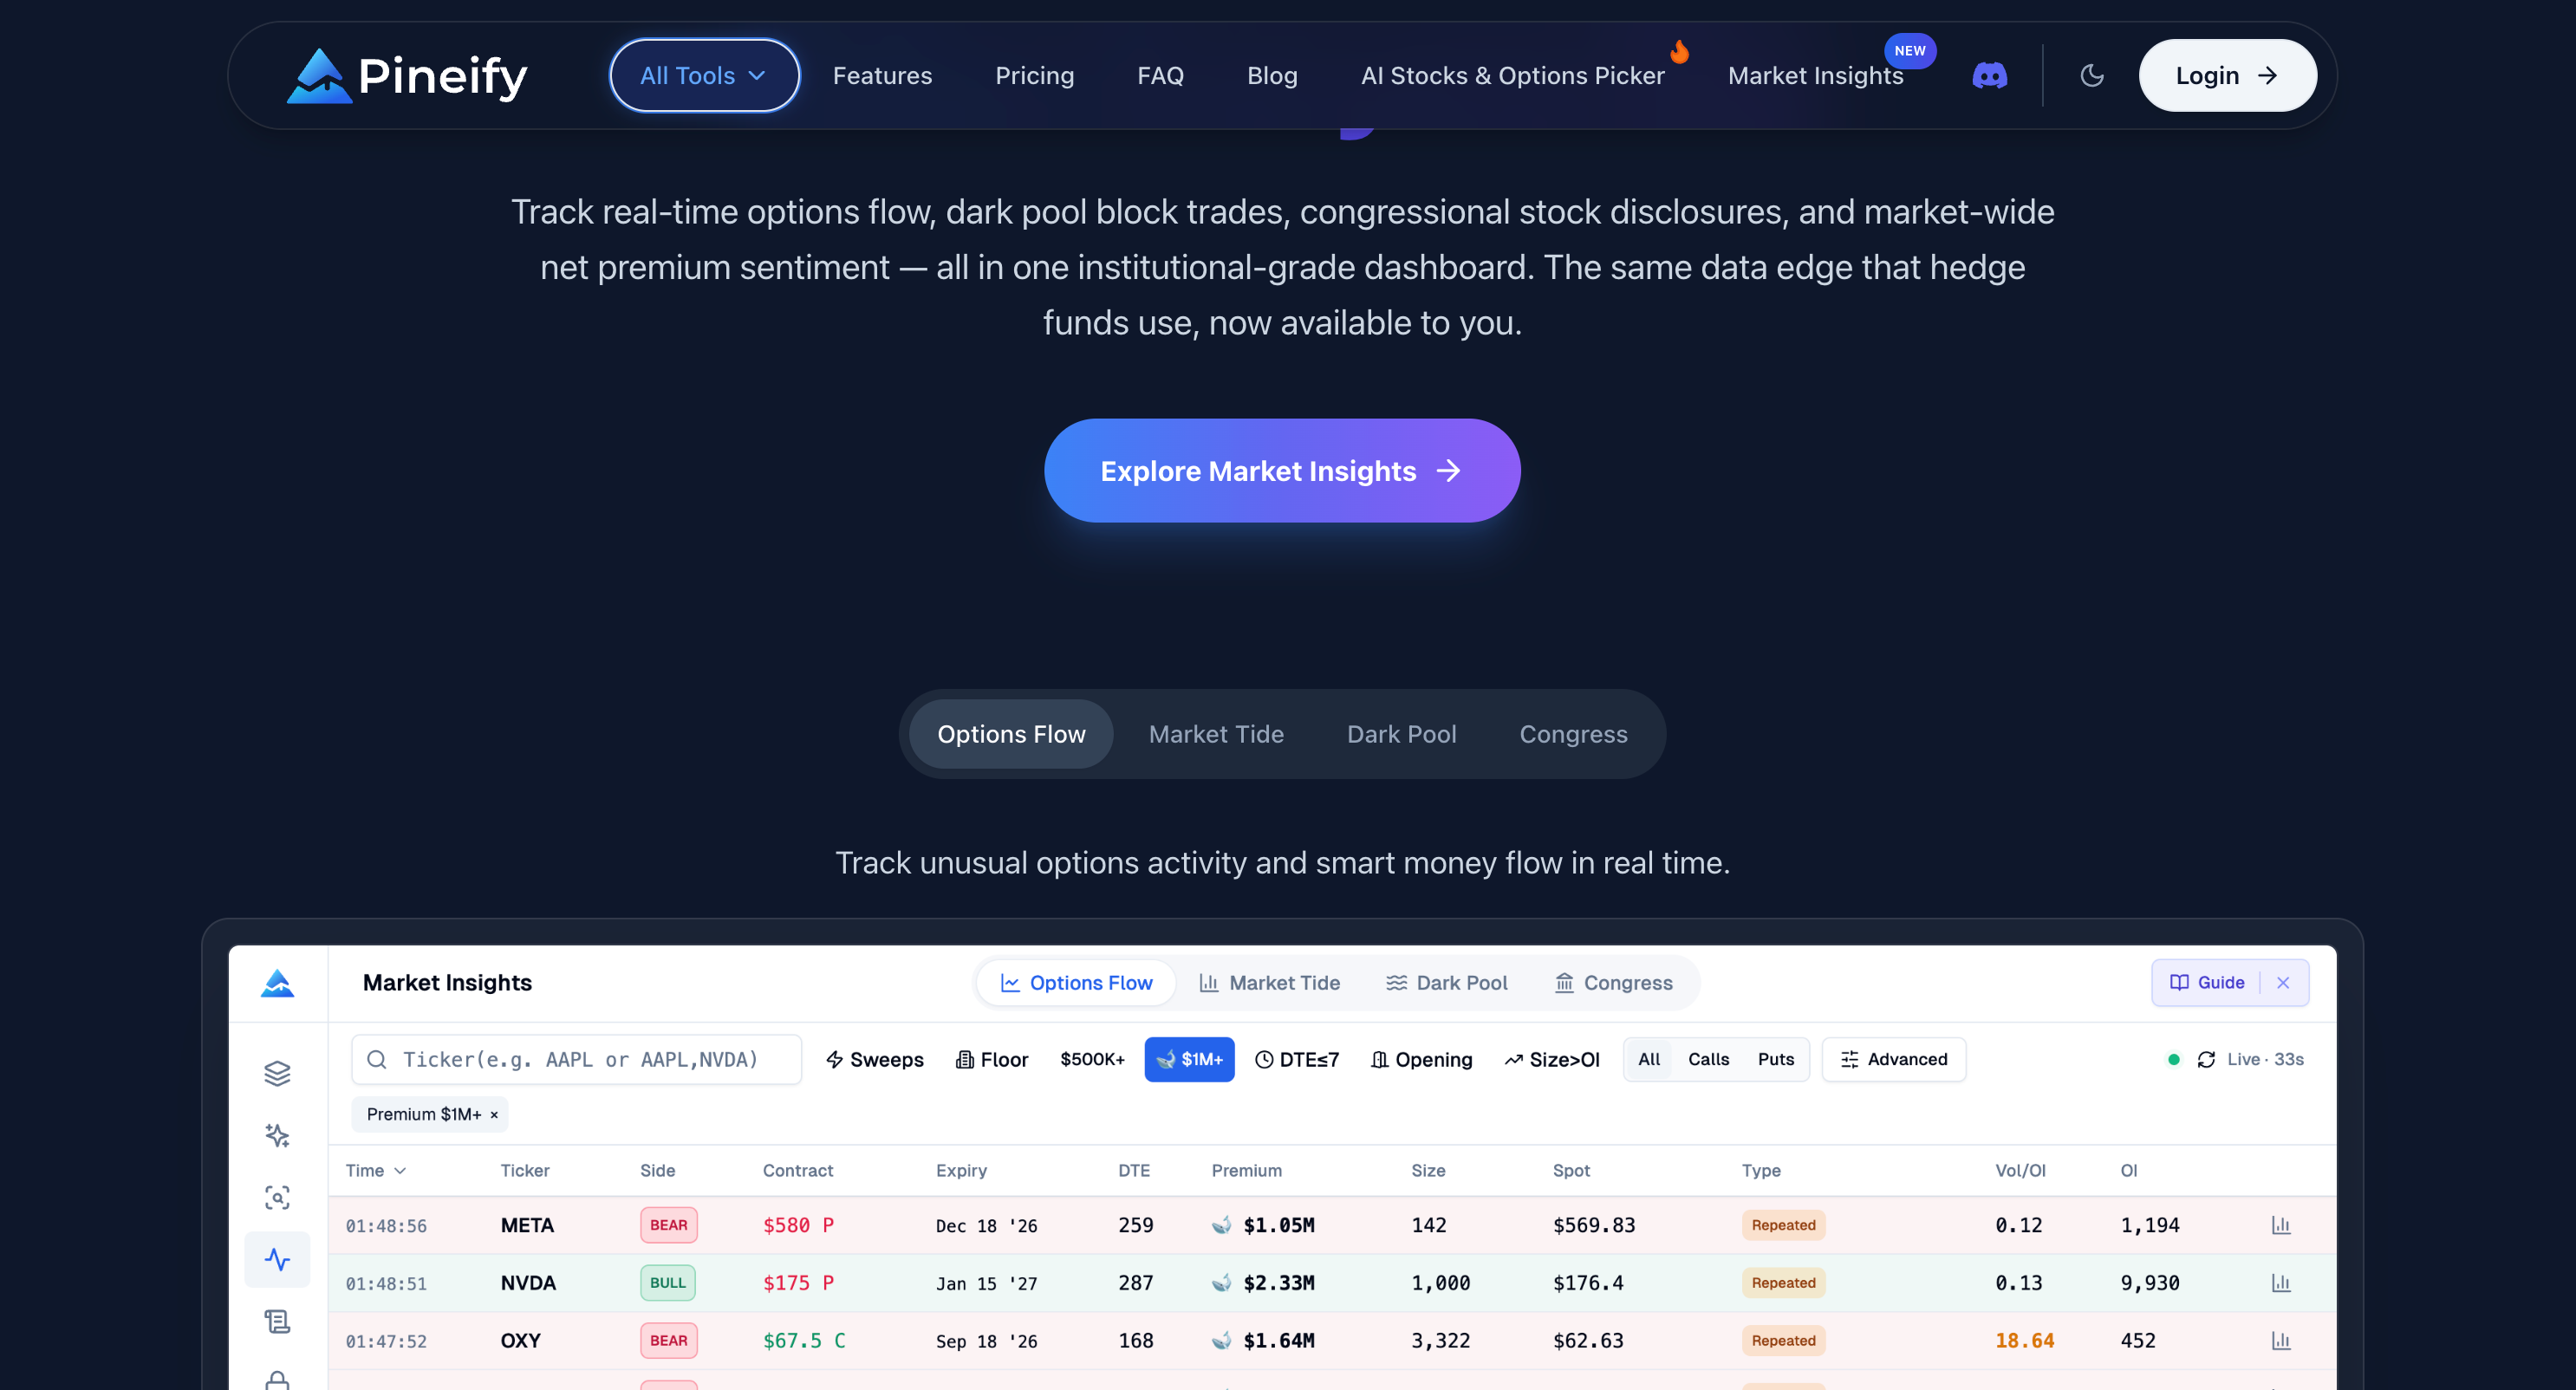
A congressional trading viewer is a tool that tracks stock trades made by U.S. lawmakers and their families, sourced from mandatory STOCK Act filings. Members of Congress sit on committees that shape policy in the same industries where they invest. I've seen this play out with specific names—like when multiple defense committee members filed NVDA buys in Q3 2024, just before a major military AI contract was announced. The law requires disclosure within 45 days, but raw filings from the House and Senate are scattered and hard to parse. That's the gap Pineify Market Insights fills—it pulls that data together with options flow, dark pool trades, and sector sentiment in a single view. For traders building automated systems around these signals, our TradingView algorithms guide covers the setup.
Why This Trading Data Is Worth Your Attention
Multiple academic studies have found that congressional stock portfolios consistently beat the S&P 500 by 5–10% per year. Straightforward strategies that mirror these trades have returned over 21% in a single year—roughly double the market's average. To test these strategies yourself, our Metatrader 4 backtesting guide walks through the process.
I noticed that in late 2024, the defense appropriations bill triggered a cluster of congressional buys in RTX and LMT—those filings showed up in Pineify within 48 hours.
The edge probably comes from early access to legislative details or committee insights. Whatever the source, when Congress trades, it's often a useful signal.
The raw disclosure data from the House and Senate is messy and hard to use. That's why a congressional trading viewer that cleans, organizes, and highlights this information as it happens matters.
Four Data Sources, One Screen
Pineify Market Insights pulls together four kinds of market data instead of requiring separate subscriptions that can cost $200+ a month:
| Module | What It Tracks | Why It Matters |
|---|---|---|
| Options Flow | Large, non-standard options trades as they happen | Shows what institutional players are doing in real time. |
| Market Tide | The total balance of money spent on call vs. put options across the market | Reflects overall market greed or fear. |
| Dark Pool | Large stock trades occurring off public exchanges | Reveals hidden price levels where institutions accumulate or distribute. |
| Congress Trading | Stock transactions reported by U.S. lawmakers and their families | Provides a window into potential political timing signals. |
In practice, you see trades from all 535+ members of Congress, tens of thousands of filtered options orders daily, and sentiment across 11 major market sectors—all refreshing in under a second.
I'll be upfront about one limitation: the congressional data has a 45-day reporting window by law, so it won't help with short-term entries. It works best as a macro confirmation signal—layered with options flow and dark pool data for timing.
Inside the Congress Trading Module
See Every Trade with Easy Search
The tool indexes every legally disclosed stock trade—buys and sells—from sitting members of Congress and their immediate families. Everything is searchable and filterable:
- By name — See every trade a specific lawmaker has made.
- By party — Filter to show only Democrats or Republicans.
- By chamber — Look at just the House or just the Senate.
- By trade type — Check only purchases or only sales.
- By date — Focus on trades around key legislative dates or news events.
Why Late Trades Are a Big Deal
A feature I haven't seen matched elsewhere is the automatic flagging of late disclosures. By law, Congress members must report stock trades within 45 days. That rule is often broken. Pineify tags those late filings automatically.
Why does that matter? A trade reported weeks late, but executed right before a major policy shift, is a red flag. The lateness itself becomes a clue pointing toward trades worth a closer look.
Deep Dive on Any Lawmaker
Click any politician's name and you get their full trading profile: most traded stocks, buy vs. sell ratio, typical trade size, and historical patterns. Some members trade constantly—making their portfolios especially interesting to track over time. I prefer cross-referencing the hottest tickers with dark pool data; when both show the same direction, it's worth a deeper look.
Spotting the Trends: Hottest Stocks
The Hottest Tickers section cuts through the individual noise by showing which stocks are being bought most aggressively by Congress overall, right now.
When lawmakers from both sides of the aisle pile into the same stock, that's a noteworthy signal. It shifts the view from one person's activity to what people with insider knowledge are doing together.
The most telling signals usually fit into one of three patterns:
| Signal Type | What to Look For | Why It Matters |
|---|---|---|
| Pre-Legislation Trades | A lawmaker buying stocks in a sector just before a major related bill is voted on (e.g., defense stocks before a big military funding bill). | Suggests possible foreknowledge of a policy shift that could move markets. |
| Committee-Aligned Trades | Members of a specific committee trading stocks in industries that committee oversees (e.g., Banking Committee members trading bank stocks). | These lawmakers have a front-row seat to drafting regulations. Their trades can hint at closed-door discussions. |
| Bipartisan Consensus | Both Democrats and Republicans buying the same stock around the same time. | Often points to a shared insight beyond party politics—usually a structural change or less-visible trend. |
These patterns on their own are interesting. But the real power comes from combining them. Spot a pre-legislation trade and then see heavy options flow or institutional buying on the same stock, and it paints a much clearer picture. The overlap of the political "when" and the market's "what" creates a high-confidence insight you couldn't get from any single source.
Pineify connects these dots. Its Market Insights dashboard tracks real-time options flow, dark pool block trades, and congressional stock disclosures in one unified view. Cross-reference a politician's trade with the "smart money" activity happening simultaneously, and you get a significant edge in understanding the full story.
How Pineify's Tools Work Together
I've been layering these signals and the strongest setups happen when all four types line up. Take HON in late 2024: options flow showed unusual call activity, dark pool prints appeared at $205, and two House members filed purchase disclosures that same week.
- Options Flow lights up with unusual call buying, suggesting experienced traders are making bullish bets.
- Dark Pool shows big block trades at the current price, which often means institutions are accumulating without moving the market.
- Market Tide indicates the stock's sector is seeing positive money flow.
- Congress Trading reports a U.S. Senator just filed a disclosure for a sizable purchase of that same stock.
Individually, any of these signals is interesting. When all four point in the same direction—from options traders, institutions, sector trends, and political insiders—it's as strong a confirmation as I've found. I wrote about a related setup in our trailing stop loss guide, which pairs well with this multi-source confirmation.
You can explore the Congress trading module here: pineify. For a broader overview of how all four modules connect, read our Pineify Market Insights overview.
Pineify vs. Other Congress Trading Trackers
I've tested several platforms that track congressional trades, and here is how Pineify compares on the features that matter most.
| Feature | Pineify Market Insights | Unusual Whales | FlowAlgo | Quiver Quantitative |
|---|---|---|---|---|
| Options Flow | ✅ Real-time | ✅ Real-time | ✅ Real-time | ❌ |
| Dark Pool | ✅ Full analysis | ✅ Basic | ❌ | ❌ |
| Congress Trading | ✅ Full tracker | ✅ Basic | ❌ | ✅ Congress only |
| Market Tide / Net Premium | ✅ Sector-level | ❌ | ❌ | ❌ |
| Unified Dashboard | ✅ All-in-one | Partial | Single focus | Single focus |
| Additional AI Tools | AI Agent, Pine Script, Backtester | Limited | None | None |
When I cross-checked Pineify's congress data against Quiver Quantitative in February 2025, I found Pineify's options flow overlay was the missing piece Quiver doesn't cover at all.
Platforms like Quiver Quantitative and Unusual Whales offer congressional trading data, but it's often a standalone feature with limited integration. Pineify puts options flow, dark pool data, and congressional trades on the same screen. You can see a politician's recent trade and immediately check the real-time options flow for that same stock without switching tabs or managing multiple subscriptions.
To see it in action: pineify.
Who Benefits From This Data
Different traders use these signals in different ways:
- Day Traders: Watch unusual options flow and dark pool activity in real time. A glance at Market Tide before entering a trade helps confirm or question the day's momentum.
- Swing Traders: Use Market Tide to spot sector rotation. Pair that with signs of quiet accumulation in dark pools and check if congressional buying aligns with your entry points.
- Options Traders: Go beyond volume and open interest. See the exact strikes, expirations, and premium sizes that institutional players are betting on.
- Long-Term Investors: Track stocks that political insiders and major institutions are steadily building positions in through dark pool activity.
- Quantitative Traders: Feed the structured data into systematic strategies based on congressional disclosure patterns. Tools like our automatic stop loss and take profit indicator for TradingView can manage the risk side of those strategies.
* This tool provides data for informed decision-making, not financial advice. Always do your own research.
Pricing and What You Get
Pricing is straightforward: one payment, not a subscription. Pineify Market Insights is part of the Expert plan at $259—a 30% discount from the original $369, with lifetime access and no recurring fees.
For that one-time fee you get:
- All Four Core Modules: Options Flow, Market Tide, Dark Pool, and Congress Trading.
- AI-Powered Research: The AI Finance Agent for stock analysis and the AI Stocks & Options Picker.
- Custom Tools Building: The Pine Script AI Coding Agent (with 2,500 monthly credits) and the Visual Pine Script Editor.
- Strategy Testing: The built-in Strategy Optimizer and Backtester.
- Premium Indicators: Access to the invite-only Pineify Signals & Overlays.
- Trading Journal: To track and review your performance.
- Future Updates: Priority access to all new features and lifetime updates at no extra cost.
Why does the lifetime model matter? Similar platforms that track options flow run on subscriptions between $55 and $75 per month. At $259 one-time, Pineify essentially pays for itself in about 3 to 4 months. After that, the tools keep working.
You can explore all the details directly on the pineify website.
Q&A: Understanding Congressional Stock Trading Data
Q: Is it legal to trade based on congressional disclosure data? Yes, completely. The STOCK Act requires members of Congress and their spouses to publicly report their stock trades. These are official public records, similar to corporate SEC filings. Using that information to inform your own trades is perfectly legal.
Q: How accurate is the congress trading data? The data comes straight from official filings submitted to the House and Senate. Pineify pulls from these records automatically and flags reports filed after the legal deadline.
Q: How quickly are new disclosures added to the platform? The system checks government websites constantly for new filings. When a politician files a disclosure, it's picked up and added quickly—often in near real-time during busy filing periods.
Q: Can I set alerts for specific politicians or tickers? Yes. Each member of Congress has their own detailed profile showing all activity, and you can filter the data to see every trade for a specific stock. Alerts are a core feature of the notification system.
Q: Does the platform include spouse trades? Yes. The law requires it. Trades made by a member of Congress's spouse must be disclosed, and Pineify includes all those transactions in the politician's complete history.
Q: What happens if a lawmaker files late? This is a key feature. The STOCK Act requires trades to be reported within 45 days. Pineify automatically flags any trade reported after that deadline. Many users find the late disclosure signal to be one of the most useful insights on the platform.
Next Steps: Start Following the Smart Money
Congressional trading data is one of the most underused signals available to retail investors. It's public, it's legal to act on, and most people ignore it entirely. Here's how I'd suggest getting started:
- Browse the dashboard. Head over to pineify.app/market-insights and check out the Congress Trading module to see how the data flows.
- Pick the right plan. The Expert plan gives you access to all four Market Insights modules plus the rest of the analytics toolkit.
- Check what's trending. The "Hottest Tickers" view shows which stocks Congress members are buying right now.
- Enable late disclosure alerts. Trades reported after the 45-day legal deadline often flag the most significant activity.
- Layer the signals. A congressional buy paired with unusual options flow and dark pool accumulation is a much stronger signal than any single data point.
The data that used to be only available to Wall Street and D.C. insiders is now accessible to anyone. Early adopters tend to spot opportunities before the broader market catches on.
Ready to explore? Start at pineify.app/market-insights.