ATR Pips Indicator: Convert ATR to Pip Values for Forex Stop Losses

Ever stared at your ATR indicator wondering what the heck 0.00125 means for your EUR/USD trade? You're not alone. Your broker talks in pips, your risk calculator needs pips, but your volatility indicator speaks in decimals that make no sense at 2 AM when you're trying to set a stop loss.
Here's the thing—ATR is brilliant for measuring market volatility, but it's useless for forex traders who think in pips. That's exactly why the ATR Pips indicator exists. It takes that confusing decimal and turns it into something you can actually use: real pip values that make sense for your trading decisions.
What is the ATR Pips Indicator?
ATR Pips is an indicator that converts standard ATR volatility readings into pip values for forex trading. While traditional ATR gives you abstract decimal values like 0.00125, ATR Pips automatically shows you the equivalent in pips—12.5 in this case—so you can set stops and size positions without pulling out a calculator.
J. Welles Wilder created the original Average True Range to measure volatility, but he wasn't thinking about forex traders who need to know "how many pips should I risk on this trade?" ATR Pips solves that problem by doing the math for you.
Here's what makes it different:
- Automatic pip conversion: No more calculator needed to figure out what 0.00125 means in pips
- Bollinger Band overlay: Shows you when volatility is normal, high, or unusually low
- Smart point value detection: Handles both standard pairs (4-digit) and pipette pairs (5-digit)
- Error alerts: Shows a red "Invalid" marker when it can't calculate properly
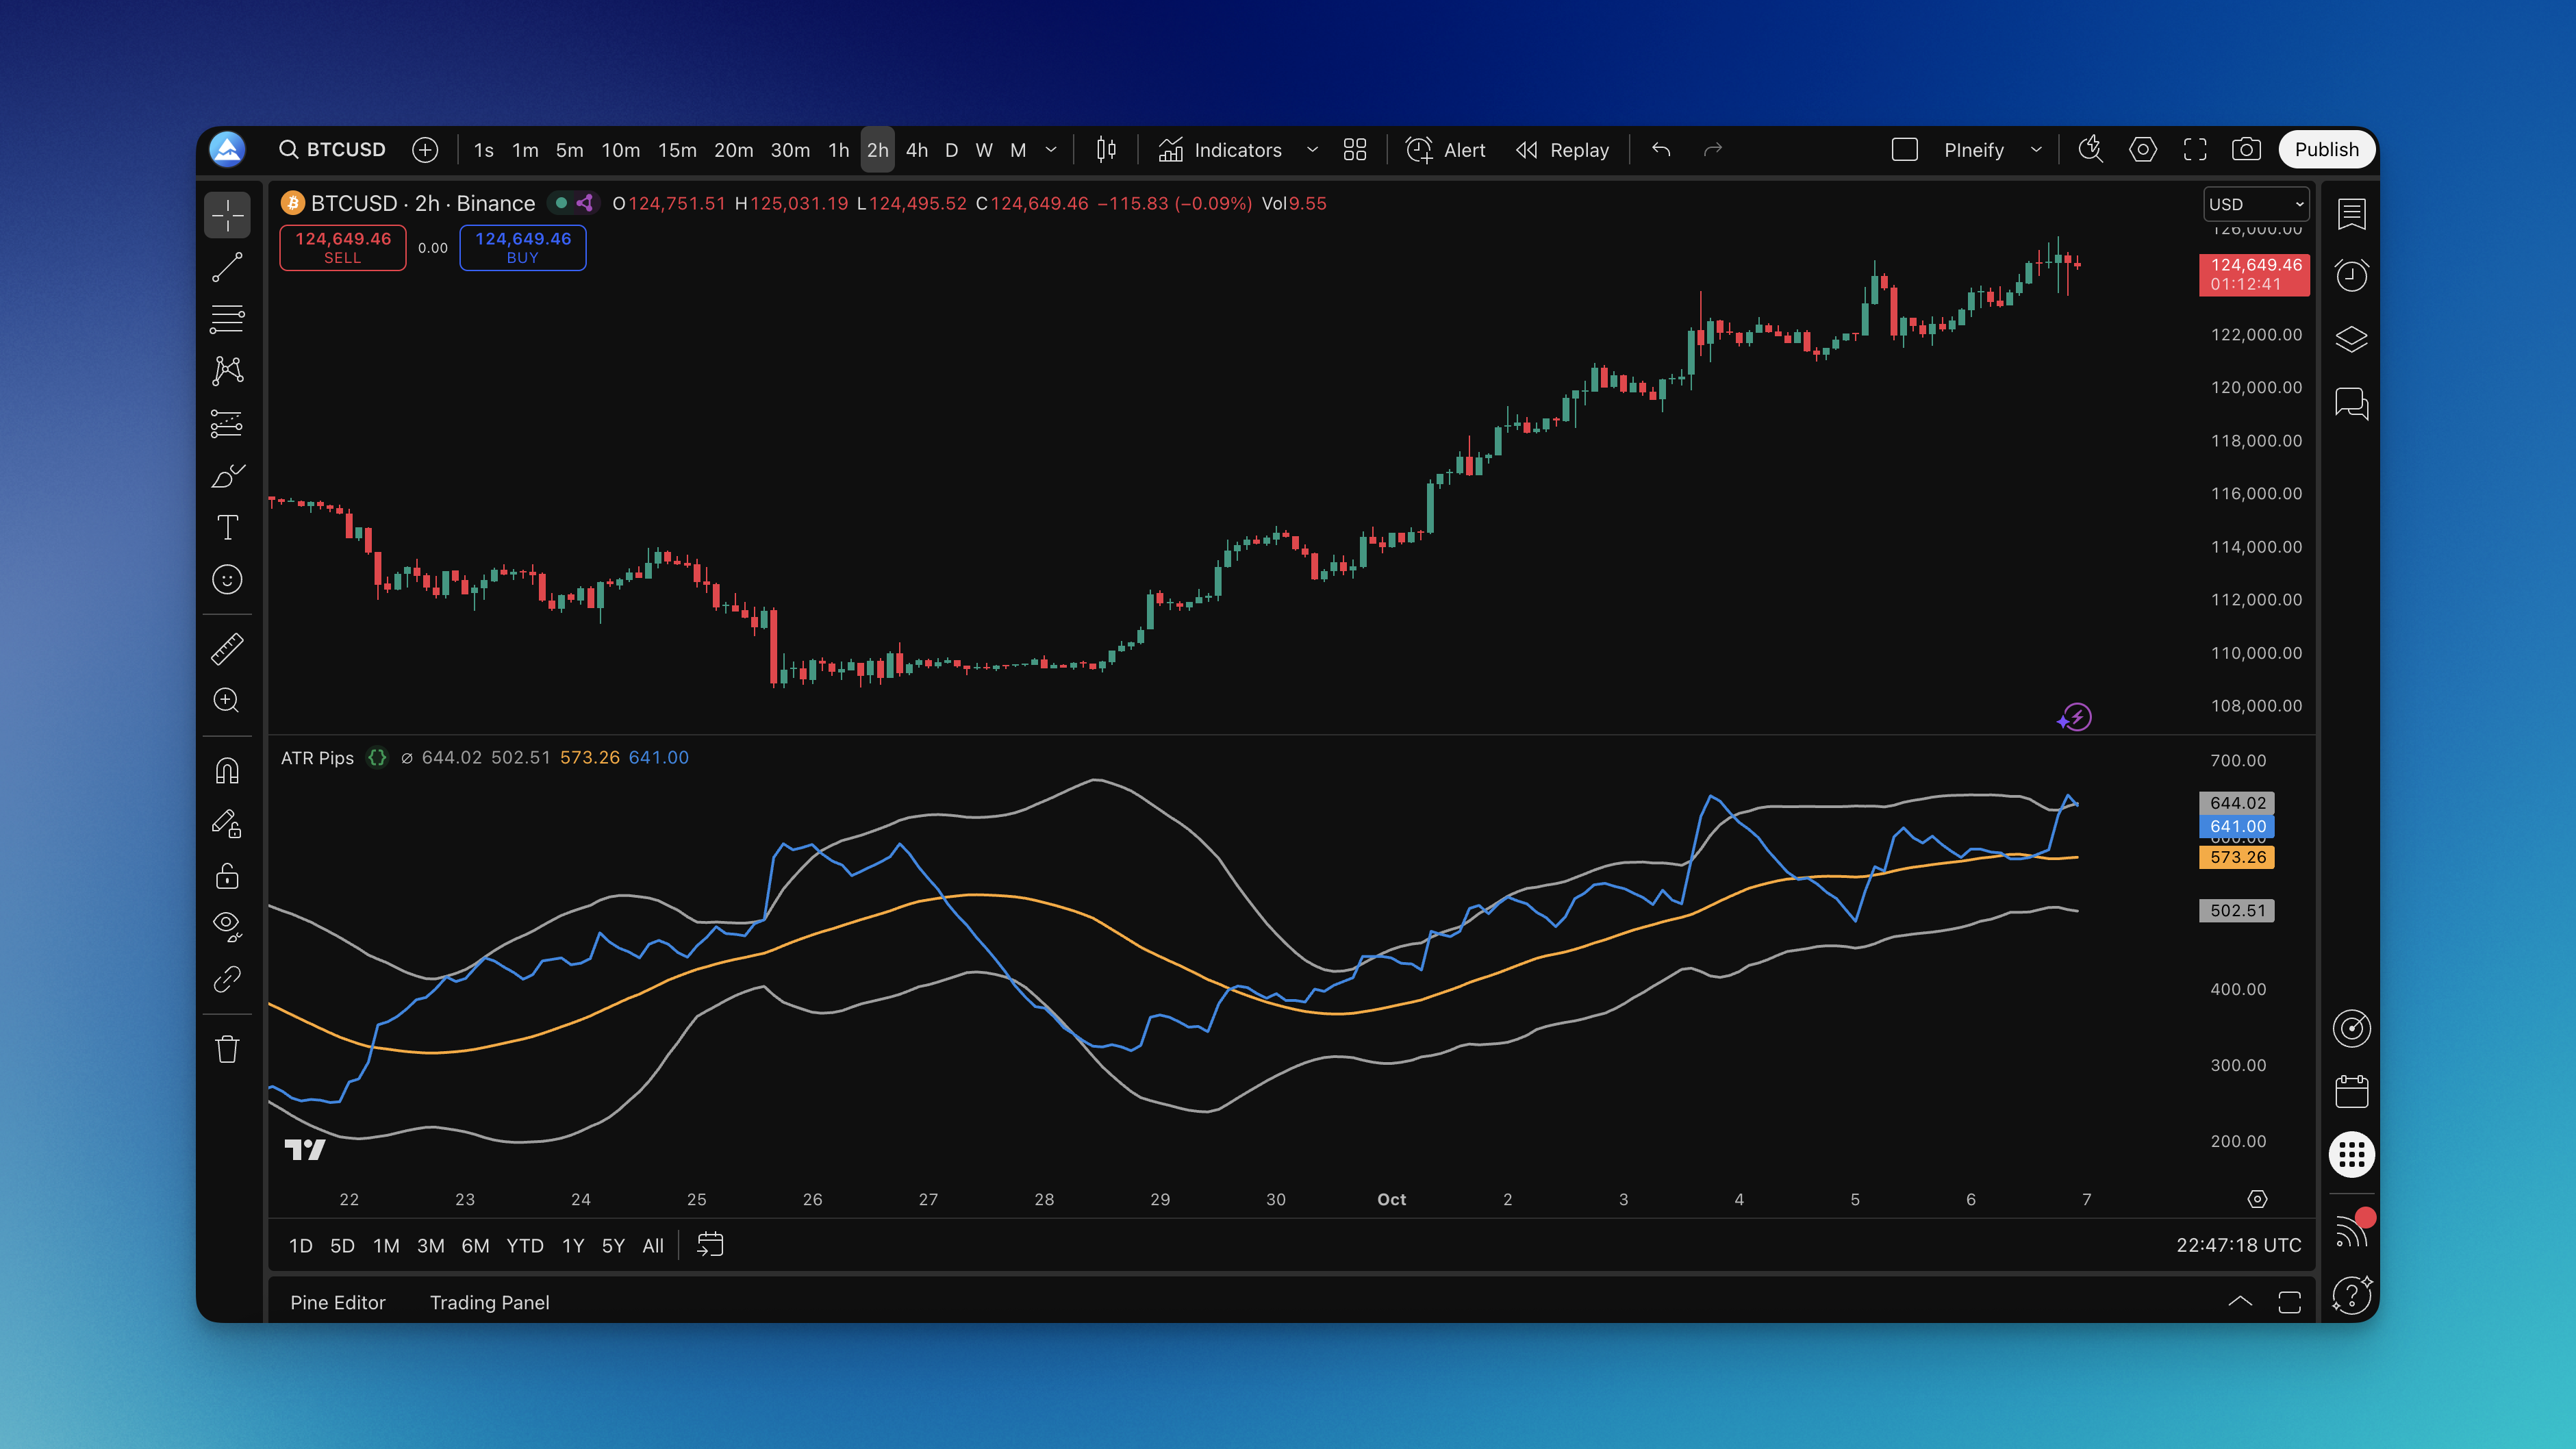
The indicator shows you several key pieces of information:
| What You See | What It Means | Why It Matters |
|---|---|---|
| Blue ATR/Pips line | Current volatility in pips | This is what you use for stop loss calculations |
| Orange middle line | Average volatility baseline | Shows you what's "normal" for this pair |
| Gray bands | Statistical volatility extremes | Spots when the market is unusually calm or wild |
| Red cross | Calculation error | Warns you when pip conversion isn't working |
Default settings work for most traders: 20-period ATR, 34-period Bollinger Bands with 2 standard deviations, and a 0.7 multiplier for the conversion.
I've been testing this on GBP/JPY recently, and the difference between ATR and ATR Pips becomes obvious fast. On a standard 20-period setting, GBP/JPY's ATR showed up as 0.897—basically useless for my stop placement. ATR Pips converted that to 89.7 pips, which I could actually plug into my risk calculations. That alone saved me the mental math I'd normally do at 3 AM.

How to Add ATR Pips Indicator to TradingView
Getting ATR Pips on your chart takes about 30 seconds:
Method 1: Pine Script Editor
- Click the Pine Editor tab at the bottom of TradingView
- Paste the ATR Pips code into the editor
- Hit "Save" and name it something like "ATR Pips"
- Click "Add to Chart"
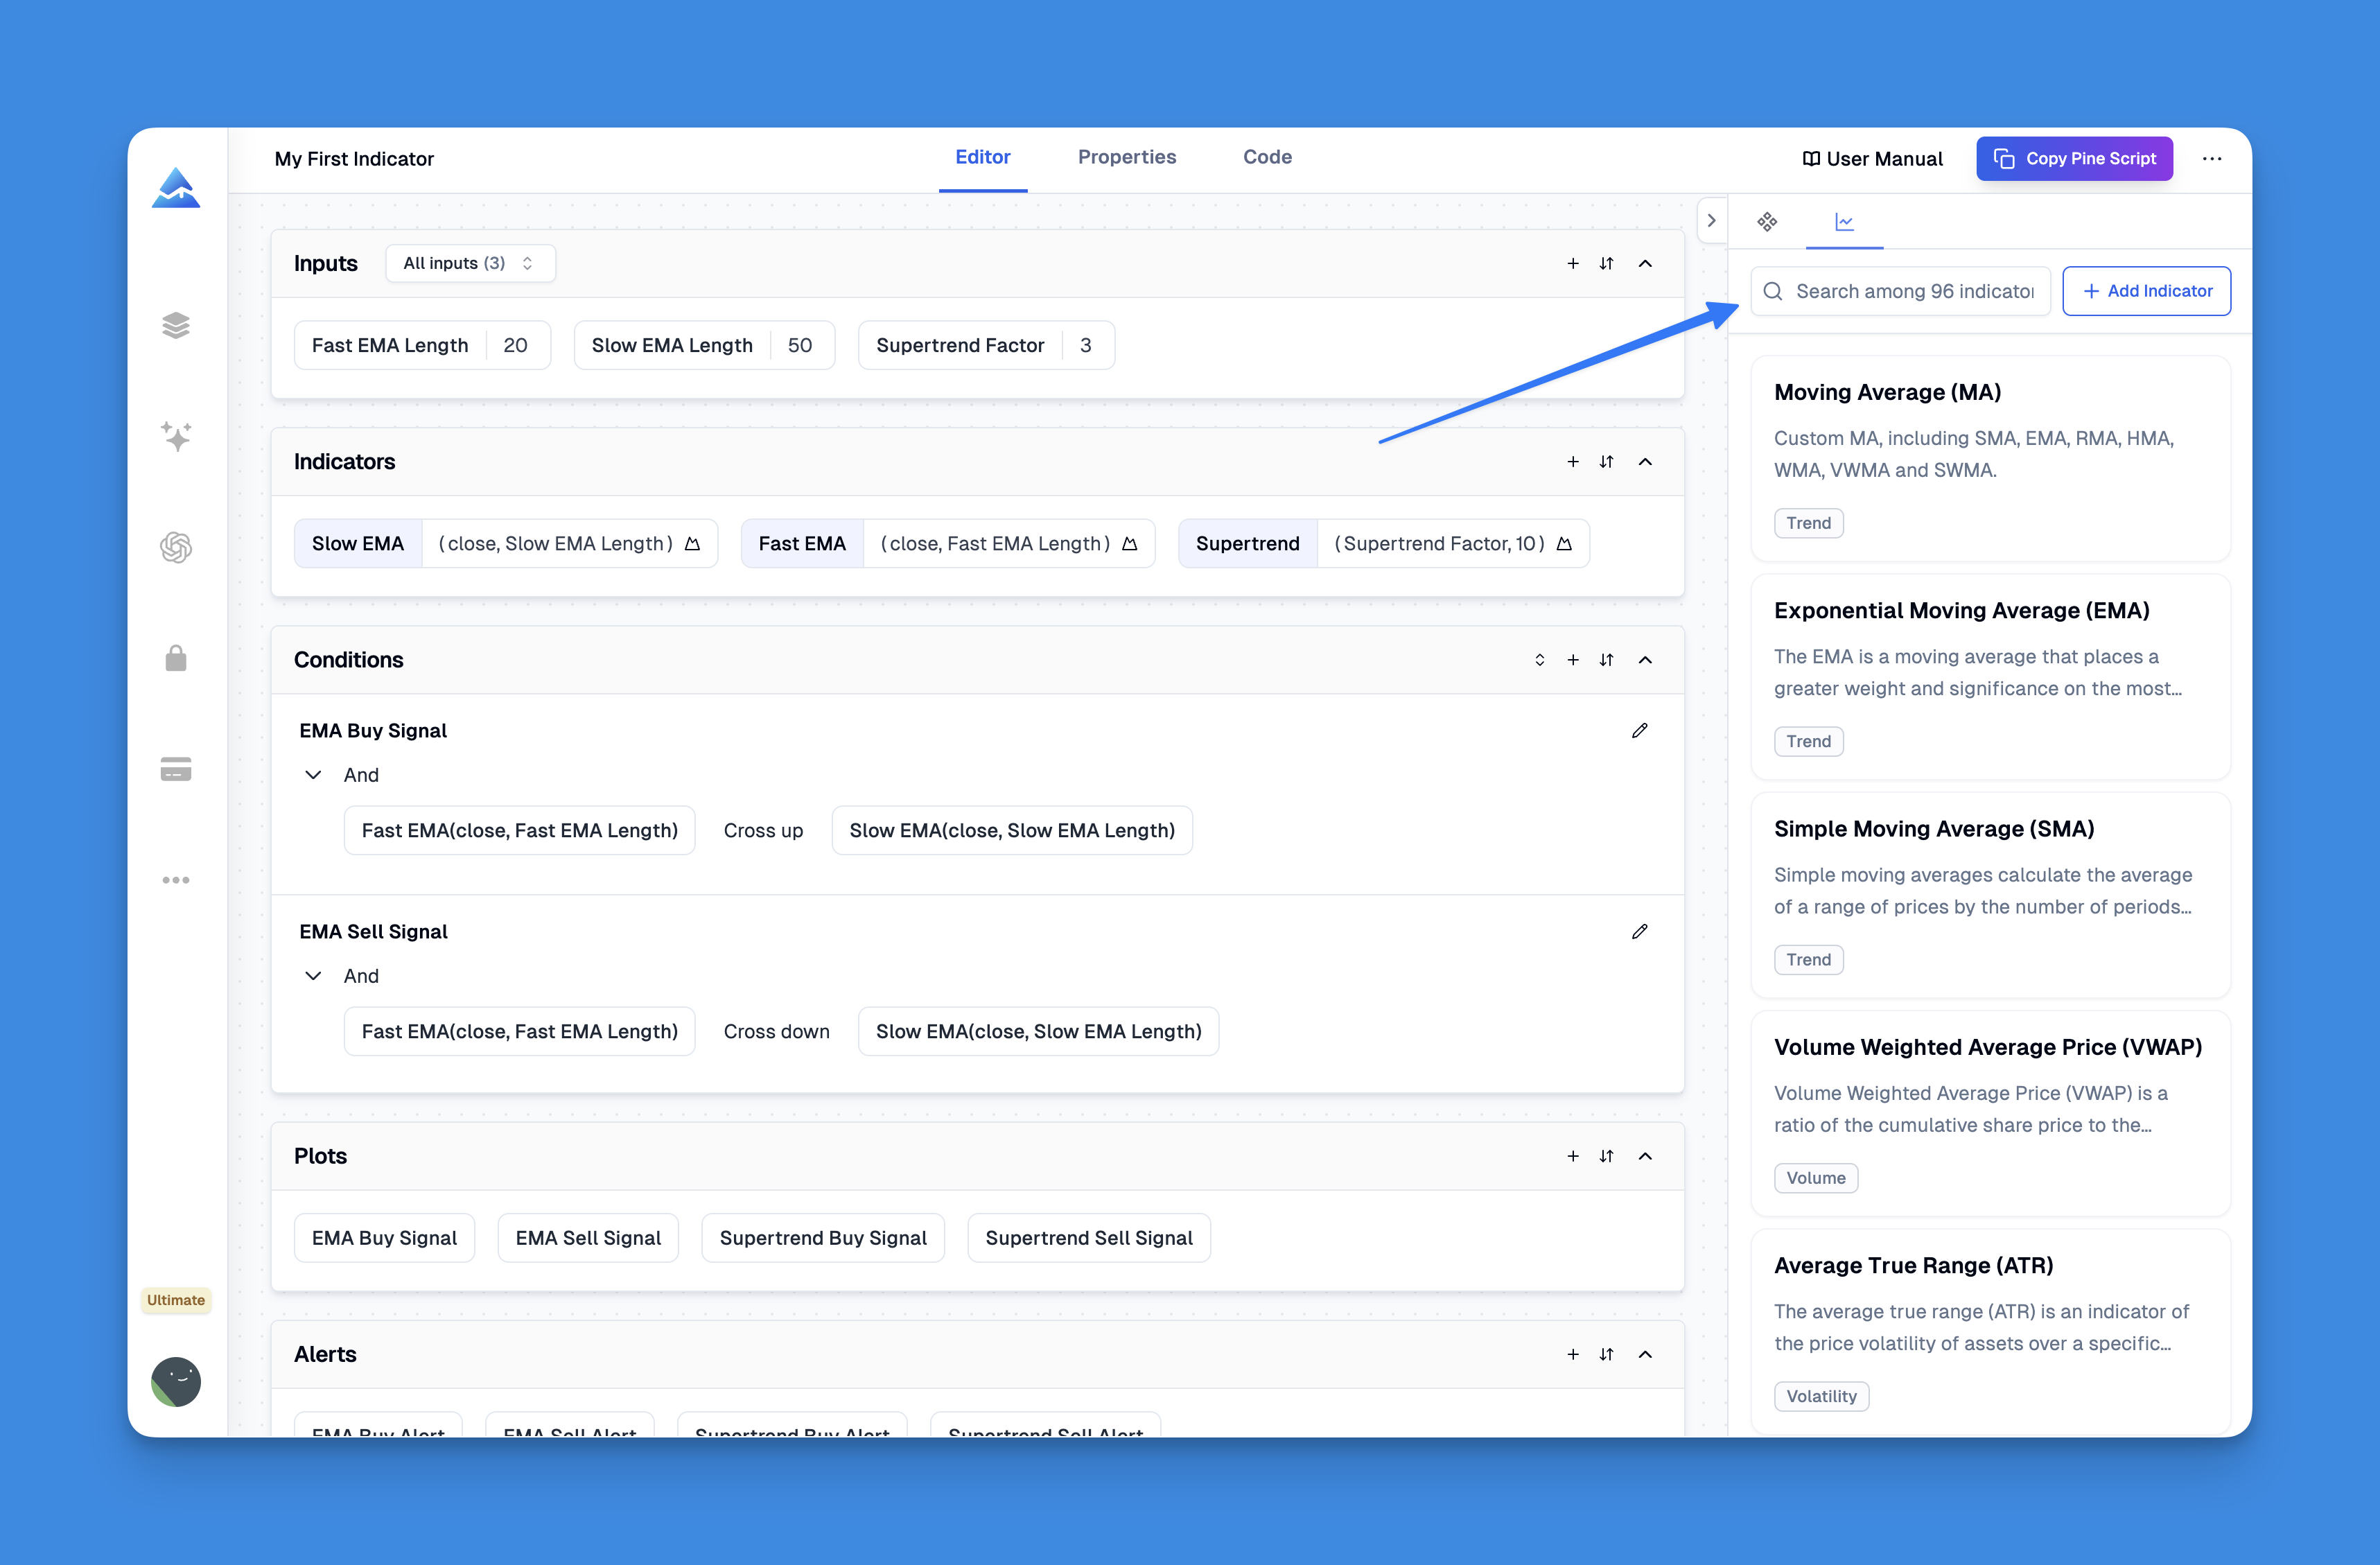
Method 2: Pineify Platform
- Go to the Pineify editor
- Search for "ATR Pips" in the indicator library
- Click to add it to your chart
- Adjust settings in the panel that appears
The indicator appears in its own pane below your price chart. You'll see the blue line bouncing around showing current volatility in pips, plus the orange baseline and gray bands for context.
How to Actually Use ATR Pips for Better Trading
Most traders overcomplicate this. ATR Pips is simple—it tells you how much the market typically moves so you can set logical stops and position sizes.
Reading the Signals
The blue line is your main focus. When it's low, the market is sleepy. When it spikes up, things are getting volatile. The orange line shows you what's "normal" for this pair over your chosen period.
Those gray Bollinger Bands are your volatility extremes. Blue line touching the top band? Market's going crazy—maybe wait for things to calm down. Blue line at the bottom? Market's dead quiet—could be building up for a big move.
I prefer using the 2x multiplier for most of my EUR/USD trades. It's not perfect—I've had times where 2x was too tight on news days and I got stopped out before price reversed. On those days, I bump it to 3x. You'll want to adjust based on what you're seeing in your own charts.
Setting Stop Losses That Make Sense
Here's where ATR Pips really shines. Instead of random stop losses, use the actual volatility:
- Tight stops: 1.5x current ATR Pips value
- Normal stops: 2x ATR Pips (most common)
- Wide stops: 3x ATR Pips for volatile markets
Say ATR Pips shows 25 pips and you're using the 2x method. Your stop goes 50 pips from your entry. Simple math, logical placement.
Position Sizing Made Easy
ATR Pips turns position sizing from guesswork into math:
Position Size = Risk Amount ÷ (ATR Pips × Pip Value)
Risking $100, ATR Pips is 30, pip value is $1? Your position size is roughly 3.3 lots. No more random lot sizes based on "gut feeling."
Spotting Market Conditions
| What You See | What It Means | What to Do |
|---|---|---|
| Blue line near bottom band | Market's unusually quiet | Watch for breakouts; volatility might explode |
| Blue line between bands | Normal market conditions | Trade your regular strategies |
| Blue line near top band | High volatility period | Use wider stops or smaller positions |
| Blue line climbing | Volatility increasing | Trend might be gaining strength |
| Blue line falling | Market calming down | Trend might be losing steam |
Best Settings for Different Trading Styles
The default settings work fine, but you can optimize based on how you trade.
Day Trading Settings
Most day traders stick with the defaults:
- ATR Length: 20 periods
- Percent Multiplier: 0.7
- Bollinger Length: 34 periods
- Bollinger Multiplier: 2
These balance responsiveness with stability—you get current volatility info without too much noise.
Scalping Settings
For quick trades, make it more responsive:
- ATR Length: 10-14 periods
- Bollinger Length: 20 periods
- Bollinger Multiplier: 1.5-2
Shorter periods mean the indicator reacts faster to volatility changes, which matters when you're in and out of trades quickly.
Swing Trading Settings
For longer-term positions, smooth it out:
- ATR Length: 30-50 periods
- Bollinger Length: 50 periods
- Bollinger Multiplier: 2-2.5
Longer periods filter out daily noise and focus on broader volatility trends that matter for multi-day trades.
Currency Pair Adjustments
Different pairs behave differently:
| Pair Type | Recommended ATR Length | Why |
|---|---|---|
| Majors (EUR/USD, GBP/USD) | 20 periods | Standard settings work well |
| Minors (EUR/GBP, AUD/NZD) | 25-30 periods | Need slightly more smoothing |
| Exotics (USD/TRY, USD/ZAR) | 30-40 periods | High volatility needs longer averaging |
How to Backtest Strategies Using ATR Pips
ATR Pips isn't a trading system by itself—it's a risk management tool. But you can test how different ATR-based stop loss methods perform with your strategies.
Manual Testing Approach
- Pick your entry method: Moving averages, support/resistance, whatever you normally use
- Add ATR Pips stops: When you get a signal, set stops at 2x ATR Pips
- Track everything: Win rate, average gain/loss, maximum drawdown
- Test different multipliers: Try 1.5x, 2x, and 3x to see what works best
- Compare volatility periods: See how your strategy performs in high vs. low volatility
Using Pineify for Automated Testing
The Strategy Editor makes this much easier:
- Build your entry rules: Trend following, breakouts, reversals—whatever you trade
- Set ATR Pips stops: Configure stop loss to use your chosen multiplier
- Add position sizing: Use ATR Pips to calculate lot sizes based on risk percentage
- Set take profits: Maybe 2-3x your stop distance for good risk/reward
- Enable trailing stops: Use ATR Pips as dynamic trailing distance
The platform runs your strategy through historical data and shows you exactly how it would have performed.
What to Look For
Key metrics when testing ATR Pips strategies:
- Win rate: What percentage of trades are profitable
- Average trade: Mean profit/loss per trade
- Profit factor: Total profits divided by total losses
- Maximum drawdown: Worst losing streak
- Sharpe ratio: Risk-adjusted returns
Test different ATR multipliers to find the sweet spot between staying in winning trades and cutting losses quickly.
Combining ATR Pips with Other Indicators
ATR Pips works great with other tools since it handles the risk management while they handle direction and timing.
With Trend Indicators: Use moving averages or MACD for direction, ATR Pips for stops. When the trend is strong and ATR Pips is rising, you might use wider stops to stay in the move.
With Momentum Oscillators: RSI or Stochastic can show overbought/oversold conditions, while ATR Pips tells you how much volatility to expect. High RSI + low ATR Pips might signal a quiet reversal coming.
With Support/Resistance: When price approaches a key level and ATR Pips is low, the market might be coiling for a breakout. High ATR Pips near support/resistance suggests the level might not hold.
I haven't tested ATR Pips with crypto pairs yet, but based on how it handles exotics, I'd expect you'd need longer ATR periods there too. For swing traders, the Average True Range Percentage indicator offers another perspective on volatility analysis. You can also check the best swing trading indicators guide to see how multiple tools stack up together.
ATR Pips solves a real problem that every forex trader faces: converting volatility measurements into something you can actually use. No more mental math, no more guessing at stop loss placement, no more arbitrary position sizes. It won't tell you which direction to trade—that's your job. But it'll help you manage risk consistently based on what the market is actually doing, not what you think it should be doing.
Use it to set logical stops based on real market movement. Apply it to position sizing so you risk the same amount regardless of volatility. Watch the bands to spot when the market might be building up for a big move or when things are getting too crazy to trade safely. Start using the ATR Pips indicator on TradingView and see if it tightens up your risk management.
Frequently Asked Questions
What's the difference between regular ATR and ATR Pips?
Regular ATR shows volatility in decimal format—0.00125 for EUR/USD, which isn't useful for stop placement. ATR Pips converts that to something you can use, like 12.5 pips. That's the number you actually plug into your stop loss and position size calculations.
Why does a red Invalid marker show up sometimes?
That red marker appears when the indicator can't calculate pip values for whatever symbol you're looking at. It usually happens on non-forex charts. ATR Pips is built for currency pairs, so stocks, crypto, or commodities won't work with it.
What settings work best for day trading?
I stick with the defaults for day trading: 20-period ATR, 0.7 multiplier, 34-period Bollinger Bands at 2.0. They give you enough responsiveness without bouncing around too much. If you're scalping, try cutting the ATR period to 10-14.
Do I need different settings on different timeframes?
ATR Pips adjusts automatically to your timeframe. A 5-minute chart will show smaller pip values than a 1-hour chart—that's normal. For lower timeframes, shorter ATR periods (10-14) work better. For higher timeframes, go longer (30-50) to smooth things out.
How do I actually set stops using ATR Pips?
Multiply the ATR Pips reading by your multiplier. I use 2x for normal conditions—if it shows 25 pips, my stop goes 50 pips from entry. Go 1.5x for tighter stops or 3x when the market is choppy. Test each on your own charts first.
Can I pair ATR Pips with other indicators?
Yes, and I'd say you should. ATR Pips handles risk management. Pair it with moving averages for direction or RSI for momentum signals. Together they cover both sides—where the market might go and how much room it needs to get there.